Although solid waste AD facilities are just starting to emerge, haulers and their customers may see some benefits if the development trend continues. A Pro Forma Model objective can be constructed for strategic planning of an anaerobic digestion facility.
Marc J. Rogoff, Ph.D. and Bruce J. Clark, P.E.
Anaerobic digestion of food wastes in the U.S. is a developing market that is poised for continued growth in many regions. Although solid waste anaerobic digestion facilities are just starting to emerge, haulers and their customers may see some benefits if the development trend continues. This article discusses what an anaerobic digestion plant does, and what the authors see as the economics where they recently have been installed and are operating.
Anaerobic Digestion
Anaerobic digestion is the bacterial breakdown of organic materials in the absence of oxygen. This biological process produces a gas, sometimes called biogas, principally composed of methane (CH4) and carbon dioxide (CO2). The anaerobic process is most often used to treat organic wastes other than unsegregated MSW, such as sewage sludge (biosolids produced from treated sanitary sewage at a wastewater treatment plant), yard vegetation, agricultural wastes (both animal and plant) and some industrial waste sludge. Depending on the waste feedstock and the system design, biogas is typically composed of 55 to 75 percent methane. The anaerobic digestion process occurs in three steps:
- Decomposition of plant or animal matter by bacteria into molecules such as sugar.
- Conversion of decomposed matter to organic acids.
- Organic acid conversion to methane gas.
Anaerobic digestion (AD) can occur naturally in a landfill or in a controlled environment such as manufactured chamber or vessel. In an AD facility the incoming waste stream is initially processed for removal of potential contaminants, reduced in size and delivered to an air-tight reactor vessel, typically called a “digester”. AD facilities are usually classified based on whether the system uses a single reactor or multireactor system, and if water is added for processing (wet systems) or absent during processing (dry systems).
There are more than 200 AD facilities around the world with operating capacities greater than 2,500 tons per year (TPY). These plants process not only the organic fraction of the MSW waste stream but also organic waste from food industries and animal manure. Europe leads in the number of AD plants and total installed capacity principally due to the European Union Directive that requires member states to reduce the amount of landfilled organics by 65 percent by 2020. There are more than 120 plants processing about 4.6 million tons per year of organic fraction of MSW in Europe.
The “dry” system technology has been adapted to manage parts of the municipal solid waste (MSW) stream and is the current preferred technology in the U.S. for processing of organics in typical MSW. Currently in North America there are four commercially operating “dry” AD facilities, where the feedstock is primarily organics from MSW (see Table 1).
SmartFerm Anaerobic Digesting System
The Monterey Regional Waste Management District (MRWMD) AD system system was developed by Zero Waste Energy, LLC (ZWE). ZWE is a San Jose, CA-based company that holds the exclusive U.S. license to construct and operate the German “SmartFerm™” AD technology developed by Eggersmann Anlagenbau GMbH Group of Germany (EAB). This technology is widely used in Europe and is currently used at the MRWMD’s Marina facility and at a similar, but larger plant in San Jose.
ZWE’s SmartFerm, dry anaerobic digestion system is reported to contain the following design and processing features:
- The digesters are pre-fabricated chamber “modules” that can be grouped together to provide required processing capacity (Figure 1).
- The digester operates in the thermophilic range (125 to 131o F) for optimum gas production. The average retention time in the digester is 21 days.
- Digesters are biologically self-heated through the air system and re-circulation of the liquid percolate through the material.
- This liquid percolate contains the necessary thermophilic biological constituents. Partially digested recycled material is not needed to inoculate subsequent batches.
- These AD plants require a smaller footprint than traditional wet anaerobic system.
- Following digestion, the residual is moved to another chamber where the material is partially composted using forced air. After approximately four days this material is removed and put into outside windrows to complete the composting process.
- Odors are minimized because the entire facility is enclosed and process air is circulated through a biofilter.
- The digestate emerging at the end of the process is free of pathogens (per U.S. EPA’s Process to Further Reduce Pathogen’s requirements).
The SmartFerm AD facility includes the following four major process phases described below and depicted in Figure 2:
- Supply Air and Aeration—Once the organic wastes are loaded into a digester, a hatch door is closed using a gas seal to ensure that biogas cannot escape. Each digester contains an in-floor aeration system which is activated once the door is sealed. This aeration system pumps air from outside into the organic waste to help create aerobic digestion conditions that self-heat the material to designed process conditions for the first 12 hours. A mixture of oxygen and methane is potentially combustible so the chamber air is purged to remove remaining oxygen before the anaerobic cycle commences.
- Percolate Cycle—Under anaerobic conditions, the waste materials are sprayed with conditioned process water containing thermophilic microorganisms (percolate) that begin the decomposition process and produce biogas. This percolate is pumped in a closed loop between the digesters and the heated and insulated percolate tanks located beneath the digester units. Percolate continues to be sprinkled on the waste materials for approximately 20 days causing the production of biogas. Percolate is collected in a drainage system, screened for solids, and pumped back into a percolate tank where it is recharged with thermophilic organisms. Process control instrumentation ensures proper control of the percolate tank and regulation of percolate temperature.
- Biogas System—Biogas from each digester is pumped to the percolate tank to obtain a rich, homogenized biogas, then pumped to a roof-top, double-membrane storage bladder. The stored biogas is then combusted in a power plant or compressed into natural gas (CNG) for future uses.
- Exhaust Air—On the 21st day of processing (and before the digester doors are opened) ambient air within the digester is collected in an exhaust piping system. Low quality biogas (less than 20 percent methane) is combusted and the digester air is transferred to a biofilter for treatment.
The MRWMD Marina AD facility became officially operational on March 8, 2013 when the first bay of the digester was filled (Figure 3). Since that time, all of the digesters have been filled, emptied and refilled. During the AD process, biogas has been produced and collected in the storage reservoir, which is located above the digesters. On April 2, 2013, the engine generator became operational, producing the design 100kW of electricity. According to MRWMD officials, work continues to optimize the raw material mix and loading/ unloading of the digesters to minimize odors and achieve the best operational mix for the pilot facility.
Pro Forma Model
Capital Costs
For preliminary economic modeling purposes, the AD facility was assumed to consist of a variety of processes and systems including the following:
- Waste receiving building and storage area
- Waste processing and preparation
- Fermentation
- Digestate dewatering and curing
- Biogas treatment
- Energy production
- Odor control (biofilters)
ZWE was contacted in order to develop an estimated range of capital costs for the proposed AD facility. The submitted cost estimates were reviewed, adjusted as appropriate for project specifics and used on an aggregated basis. The adjusted estimates ranged from $2 to $4 million. These were planning level estimates and the actual cost of an AD facility could vary significantly from these estimates.
An AD system cost of $2,450,000 was assumed in the base case to evaluate project feasibility (Table 2). Additional sensitivity analysis can be conducted to evaluate the impact on capital costs on the overall project economics, if necessary, based on the selected area of the property for project development. For initial construction costing, we have assumed that the proposed site for the AD facility would not require extraordinary foundation design and construction modifications.
Typically, the conceptual design for a AD facility assumes that electricity would be produced for onsite uses, as well as for export to the grid. This would require an interconnect with the local utility, which would enable the AD facility to transfer electrical power to nearby facilities to offset retail purchases, sell electrical power to the local utility and to purchase standby power when the onsite power generation system is not in operation.
We have assumed that the partially composted digestate will be delivered to a composting site with nominal processing and additional cost. The conceptual cost estimate includes a chamber process air removal system and an outdoor wood chip biofilter. Operating costs were assumed to include all labor, fuel, and materials associated with the operating AD facility. Estimated labor assumes two to three full-time facility employees (plant manager, heavy equipment operator and maintenance staff).
General Assumptions for Pro Forma Model
In order to evaluate the proposed project revenues, costs savings, and expenses, a number of assumptions were made as shown in Table 3.
Model Results
A series of four model scenarios were developed to determine the financial impact to the AD project if the tonnage to the facility was increases, if the biogas was beneficially used to generate revenue or offset electricity costs. Table 4 shows the tipping fee range that would be necessary to operate the system.
Potential Feasibility
The economic Pro Forma, in this case, projected the need to an additional subsidy (in addition to the normal landfill tipping fee) to make up for the low revenue streams of electricity and digestate/compost sales. That being said, this is not to say that all facilities would require a tipping fee of around $70 per ton to become economically feasible. Relatively lucrative revenue streams can come from traditional sources such as an onsite energy user (“self-service wheeling”, which would possibly defer high retail purchase prices for power).
Further, the consultants have conducted similar feasibility assessments in areas where Renewable Energy Credits (RECs) are available and these revenue supplements definitely result in AD projects with reasonable payback periods and return on investments for their developers.
A Shift in the U.S. Market
Could AD become more widespread as a viable solid waste disposal option? As this overview discussed there are many factors, singularly or a combination, that would seem to converge for the potential to be there including; significant centralized source of high quality organic waste, relatively high power costs and utility economic incentives, limited land suitable for composting, lack of conventional waste-to-energy facilities, markets for the residual compost and/or a ban on organics disposal in landfills.
Several AD facilities using food scrap waste are operational and appear to be providing good performance. AD process system vendors, mostly from Europe, are sensing a shift in the U.S. market and are establishing bases here. The technology is adapting to our market with pre-engineered, plug and play type systems being perfected.
Although solid waste AD facilities are just starting to emerge, haulers and their customers may see some benefits if the development trend continues. With separated organic wastes, haulers could have another specialty market to serve, and also help customers transition to separating more organic waste from their garbage and potentially lowering their overall disposal bill.
Marc J. Rogoff, Ph.D., is a Project Director for SCS Engineers (Tampa, FL). He is an expert in the evaluation of solid waste rates, cost allocation studies, system valuations, and the development of master and financial plans for solid waste enterprises. He is well versed in solid waste management and micro-economics. Dr. Rogoff has held executive management positions in both local government and in the private sector. His efforts have included the development of detailed spreadsheet rate models establishing the financial feasibility of each project, long-term economic forecasts, and projected rate impact upon project users and customers. During the course of his governmental and consulting career, Dr. Rogoff has directed or conducted more than two dozen solid waste rate analyses/cost of service studies as well as engineer’s feasibility reports resulting in $1.2 billion in solid waste financings.
Bruce J. Clark, P.E., is a Project Director for SCS Engineers. . He has been involved with solid waste management for the past 24 years, and has managed master planning studies, technology evaluations, acquisitions, engineering, permitting and construction management activities at dozens of facilities including, landfills, recycling, transfer stations, MRFs, composting sites, LFG-to-energy and WTE plants, and C&D processing facilities for municipal and private clients.
Both can be reached at (813) 621-0080, via email at [email protected], [email protected] or visit www.scsengineers.com.
Table 1

Operating “dry” AD systems in North America.
Table 2
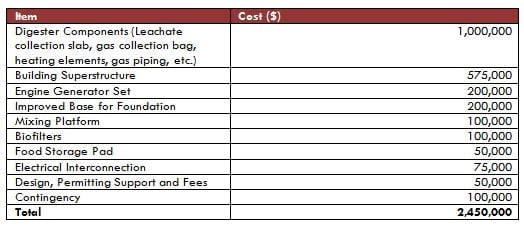
Conceptual AD plant estimate (5,000 TPY Capacity).
Table 3
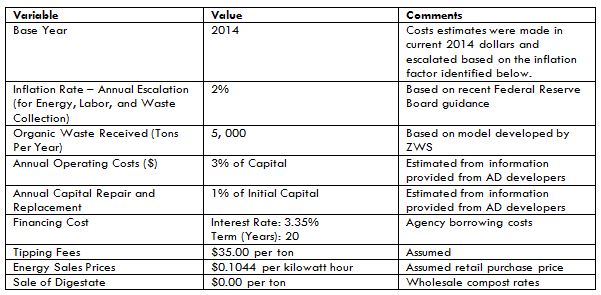
General assumptions for Pro Forma Model.
Table 4
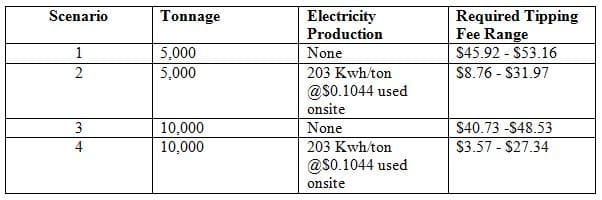
AD model results.
Tables courtesy of SCS Engineers.
Figure 1
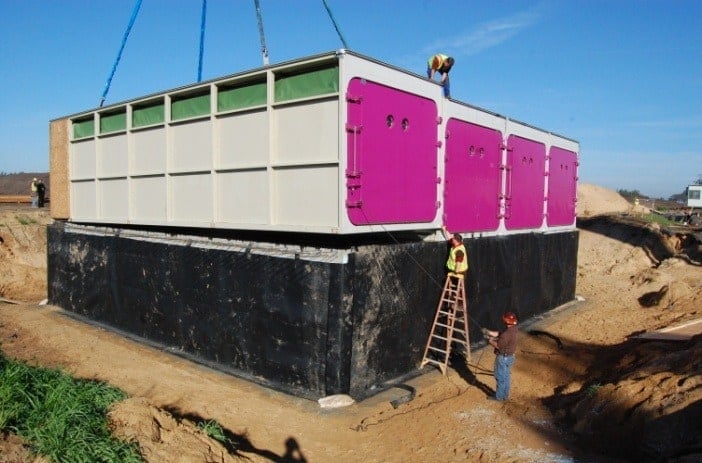
Last of four digestors installed in place.
Figure courtesy of Jeff Lindenthal, Monterey Regional Waste Management District, 2013.
Figure 2
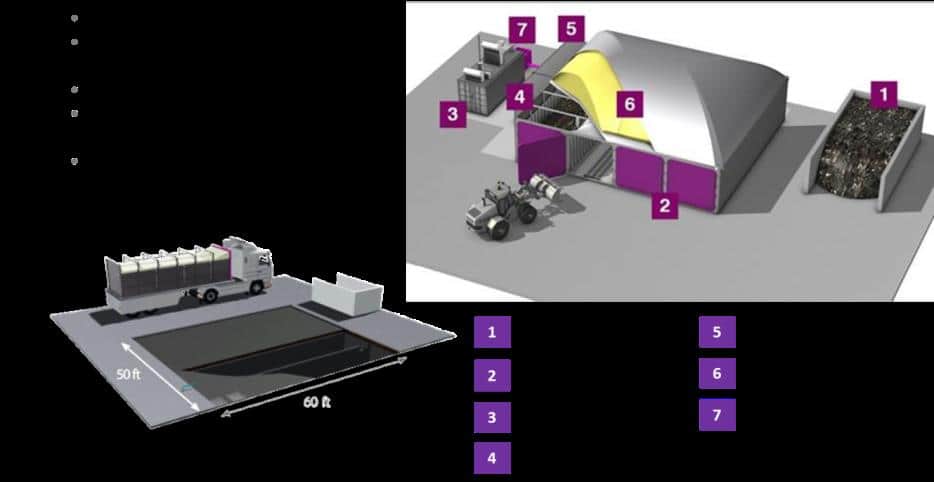
Illustrative schematic of the SmartFerm System.
Figure courtesy of Zero Waste Energy, LLC.
Figure 3

Digester bays of the Marina, CA AD facility.
Figure courtesy of Jeff Lindenthal, Monterey Regional Waste Management District, 2013.