Waste characterization studies are often done as preliminary investigations to gauge whether implementation of a new program for waste diversion is warranted. The efficacy of a desktop-based study hinges on the assumption that the composition of a waste stream is determined by human behavior and resources.
By Sarah A. Gustitus-Graham, EI, PhD, Sean T. O’Donnell, PE, PhD, Montana Meeker, Marc J. Rogoff, PhD, and Mark Jackson
What if we told you that you could gain an understanding of your waste stream composition without getting dirty? “Desktop” waste characterization studies synthesize the results of field-derived waste compositions in comparable localities to estimate the composition of a target waste stream. This computer-based effort involves less cost, time, materials, and safety risks than a traditional field-based waste characterization study.
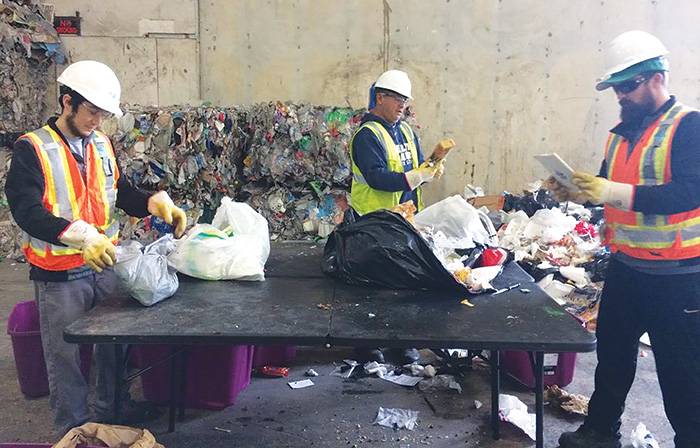
components of a waste stream. Photos courtesy of Marc Rogoff and Montana Meeker.
What is a Desktop Waste Composition Study and Why Would You Do One?
Waste characterization studies are often done as preliminary investigations to gauge whether implementation of a new program for waste diversion is warranted. The focus is often on which wastes can be “captured” via changes in outreach or collection, either in the interest of capturing a waste type as feedstock (e.g., for composting, anaerobic digestion, recycling) or in the interest of diverting waste to extend the lifespan of landfill airspace.
As the name implies, desktop waste characterization studies can be done from the comfort of a computer chair with nary a whiff of garbage. The efficacy of a desktop-based study hinges on the assumption that the composition of a waste stream is determined by human behavior and resources. Just as the people populating each locality differ, so too does their waste stream. Therefore, by accounting for similarities and differences in human behavior and resources in different areas, we can use field-derived waste compositions for various localities to predict waste composition in a target locality.
How is a Desktop Waste Composition Study Completed?
To correlate the composition of one waste stream to another, the metrics that make each locality unique (e.g., population, median income, recycling rates) must be compared. Among these metrics, some may have a stronger influence on the waste stream than others. For example, in a county with a large university, the proportionate population of students may be more important than the overall population due to the unique waste habits of students and the unique waste management tactics within a college campus.
Rather than choosing a single comparable locality that has the “right” mix of metrics to represent the waste stream being predicted, the waste stream compositions of multiple localities can be weighted based on their “fit” to the target area. An Analytical Hierarchy Process (AHP) methodology, as presented by Saaty (1994) can be used to subjectively rank the importance of metrics and subsequently score comparable studies for fit using the following steps:
1. Create subjective pairwise comparisons between metrics, using a scale of 1 to 9: For example, if median income was judged to be twice as important as population, median income would receive a score of 2 and population would receive a score of 1.
2. Use pairwise comparisons to determine a weight for each metric: Using a matrix of all the pairwise comparisons, weights can be mathematically determined for each metric.
3. Quantitatively assign scores to comparison studies based on how closely metrics match the target area: For example, if the reported median income in two study jurisdictions were found to be 2 percent and 4 percent greater than the city’s recycling rate, respectively, then the first study would be assigned a score of 2 and the second study would be assigned a score of 1 in the pairwise comparison. This is because the recycling rate for the first study was twice as close to the client’s recycling rate as that of the second study.
4. Generate final scores for each comparison study: Weights for each metric (step 2) can be multiplied by the scores for each metric (step 3), and the products can be summed to generate a final score for each comparison study.
5. Weigh the contribution of each comparison study based on score: The final step is to take a weighted average of the waste stream components from each comparison study to generate a predicted waste stream composition for the client.
Defining a series of metrics that represent human behavior and resources in an area is the core of the AHP methodology. Metrics such as population, population density, median income, and recycling rate are useful for identifying broad trends in human behavior. For example, a suburban neighborhood with large yards and lower population density would be expected to produce more yard waste than an urban neighborhood where the population is concentrated in apartments. Conversely, a low-density rural community may produce less yard waste if residents are accustomed to burning or composting this waste within their own property. Additional weighing factors may be included that are specific to the comparison set, such as access to composting facilities, frequency of waste collection, or student population.
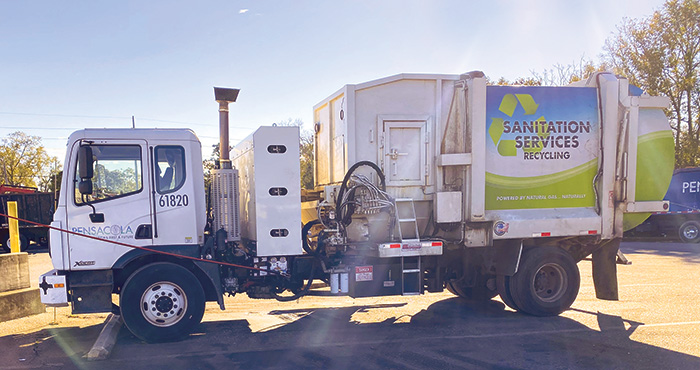
Case Study: Compostable Fraction Estimation for City of Pensacola, FL
The City of Pensacola sought to understand the quantity of organics in their waste stream as part of a preliminary feasibility analysis for waste diversion programs and technologies. So, Geosyntec completed a desktop waste characterization study for the city in spring 2022 with a specific focus on the organic waste fraction. We began by benchmarking the City’s defining characteristics against other regions with existing waste composition data including Pinellas County, FL; Alachua County, FL; Orange County, FL; Huntsville, AL; Aucilla Area, FL; and Palm Beach County, FL.
Metrics used in the AHP approach included population, median income, population density, recycling rates, tourism (represented by hotel/motel rooms per capita), and student population. The latter two metrics were selected to control for large tourism industries (in the city as well as Palm Beach and Orange Counties) and high student populations (particularly in Orange and Alachua Counties). Weights were assigned to each study based on how closely the study’s metrics matched those of the city. As a baseline, all studies were weighted against the perceived impact of population as a predictive factor. For example, in Florida, the tourism industry varies largely across the state and can affect the waste stream both materially and temporally. Thus, the number of hotel rooms per capita was deemed slightly more predictive of the waste stream than population.
The comparison studies each categorized the waste stream using a slightly different set of categories. We developed broadly encompassing categories to normalize disparities between datasets, then modeled the resulting composite waste stream by assigning these individual datasets the weights determined through pairwise comparisons. The accuracy of the method was tested by using the final metrics to predict the known waste stream of a county from the comparison set. Based on this analysis, the model was found to have an average error of +/- 2 percent per predicted waste stream subcategory. This degree of error was deemed acceptable for the city’s goal of estimating the quantity of organic waste in their disposed waste stream.
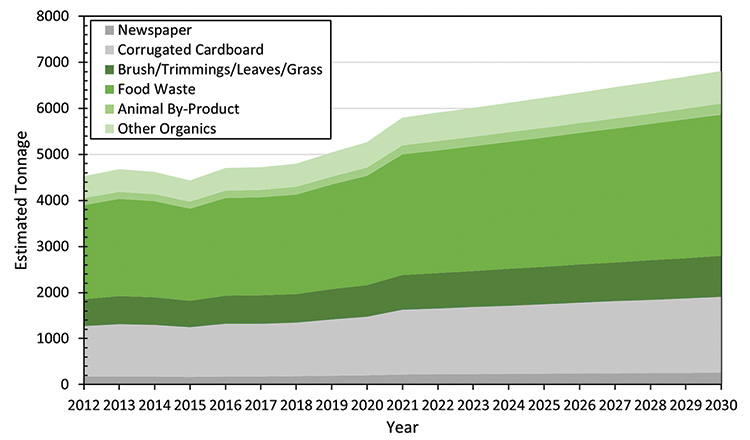
The waste component proportions were applied to actual and projected MSW tonnages for the city to estimate the total projected tonnage of each component category. Paper, plastic, and organic materials were estimated to make up the majority of MSW in the City’s wasteshed. An estimated 5,803 tons of compostable materials were estimated to be present in Pensacola’s waste stream in 2021, with the potential to increase to 6,814 tons by 2030. While actual capture rates will depend on the programming and infrastructure implemented by the city, the desktop waste characterization offered valuable insight into the upper limit of compostable waste that could be diverted from landfilling—and all without touching a single rotten banana!
Lessons Learned
The desktop waste characterization study was a useful tool for Pensacola’s preliminary feasibility study, offering valuable information while conserving budget. To make the most of a desktop waste characterization, the following should be considered:
• Comparison studies should be carefully selected for similarity to the target area. A comparison study with excessively disparate qualities can skew the results, even when a low weight is applied using the AHP approach. For example, when seeking comparison studies for Pensacola, we avoided characterization studies from South Florida due to significant differences in culture, economy, and population density, despite this area being in the same state.
• Desktop waste characterizations are most useful for preliminary investigations where error tolerance is higher or the category of interest in broad. Both were true for the Pensacola desktop waste characterization study. In contrast, if the proportion of HDPE in the waste stream was desired to capture as feedstock for a specific recycling process, a traditional waste characterization study would be more useful. This is in part because comparison studies use different categorizations that may obscure the proportions of specific materials.
• Local knowledge of both the target waste shed and comparison waste sheds facilitate accurate comparisons. Despite the University of West Florida being near Pensacola, the university does not fall within city limits. Therefore, the student population represented in other waste characterization studies was carefully accounted for so as not to skew results. A waste characterization study specific to the University of Florida was considered, but ultimately not used due to differences in behavior between university students and typical residents expected in Pensacola.
Ultimately, desktop waste characterizations are a valuable new tool that can provide useful, reliable results with reduced cost, time, and hazards—and they smell better, too. | WA
Sarah A. Gustitus-Graham, EI, PhD is a Professional at Geosyntec Consultants, Inc. (Tampa, FL). She can be reached at (813) 379-4407 or [email protected].
Sean T. O’Donnell, PE, PhD, is a Project Engineer at Geosyntec Consultants, Inc. (Columbia, MD). He can be reached at (410) 910-7671 or [email protected].
Montana Meeker is a Staff Professional at Geosyntec Consultants, Inc. (Kennesaw, GA). She can be reached at (678) 718-4728 or [email protected].
Marc J. Rogoff, PhD, is Senior Consultant at Geosyntec Consultants, Inc. (Tampa, FL). He can be reached at (813) 810-5547 or [email protected].
Mark Jackson is Sustainability Coordinator for the City of Pensacola, FL. He can be reached at (850) 435-1649 or [email protected].
*Portions of this article were previously published in FL SWANA’s Talking Trash newsletter, Winter 2022.
Reference:
Saaty, T.L. (1994) Fundamentals of Decision Making and Priority Theory with the Analytic Hierarchy Process. Pittsburgh: RWS, ISBN 0-9620317-6-3.