Often, a few additional parameters must be analyzed during subsequent groundwater sampling events, but the additional effort to collect the necessary data to prepare a
mini-ASD is well worth the time and expense if it prevents costly Subtitle D groundwater assessment monitoring and potential corrective action measures.
By Anne Melia, CHMM
The need to evaluate potential leachate impacts to groundwater is an ever-present challenge for consultants working in landfill groundwater compliance. Developing a tool kit of methodologies to provide support in evaluating changes to groundwater chemistry is critical to provide high-quality consulting services to solid waste clients and for protection of the environment. Each state has a slightly different approach to landfill groundwater compliance. Many require a statistical analysis plan, while others use the detection of volatile organic compounds (VOCs) to trigger assessment monitoring and possibly corrective action.
However, whether the trigger is a statistically significant increase (SSI) of an inorganic parameter or the detection of a VOC or other organic compound, there are a number of tools that can be employed to evaluate the potential cause of the SSI(s). These tools can be employed as part of a regular semiannual groundwater monitoring report—a mini-alternative source demonstration (ASD) of sorts—and can provide conclusive data to prevent a facility from entering assessment monitoring. Often, a few additional parameters must be analyzed during subsequent groundwater sampling events, but the additional effort to collect the necessary data to prepare a mini-ASD is well worth the time and expense if it prevents costly Subtitle D groundwater assessment monitoring and potential corrective action measures.
Geochemical Evaluation
One of the major challenges to an evaluation is having the analytical data necessary to perform various tests. Each state has a different list when it comes to analysis of geochemical parameters, such as alkalinity (carbonate and bicarbonate), potassium and magnesium, etc. One of the best tools for evaluating potential leachate is to prepare Stiff Diagrams and Piper Plots to compare the geochemistry of groundwater to leachate. To do this, analytical data is needed for both carbonate and bicarbonate alkalinity and calcium, potassium, magnesium, chloride and sulfate. Using Kansas and Missouri as two examples, Kansas does not require the analysis of magnesium for detection monitoring at subtitle D landfills, and Missouri does not require the analysis of alkalinity and potassium. To complete the Stiff and Piper analysis, these parameters must be added to the standard groundwater analysis list. The data gathered through the evaluation of Stiff Diagram and Piper Plots often provides enough data to show changes to groundwater chemistry are not a result of a leachate impact, making additional sampling and evaluation unnecessary. In this example, Stiff Diagrams and Piper Plots were used to show the differences in leachate and groundwater geochemistry at a landfill where several low-level detections of VOCs were sporadically occurring in groundwater samples (see Figures 1 and 2).
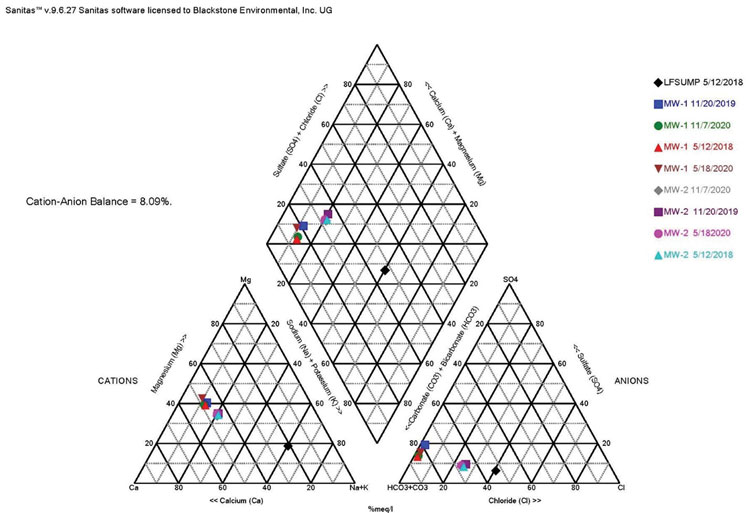
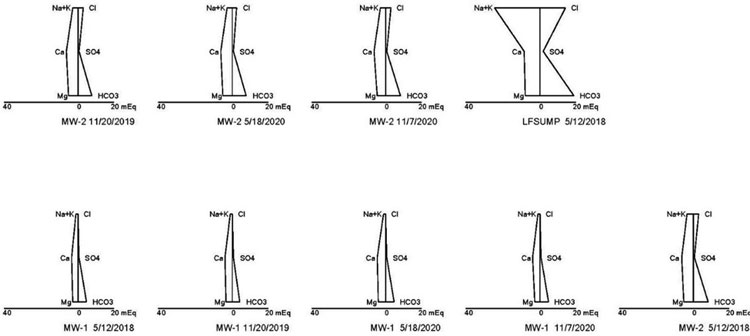
As can be seen from the Piper Plot in Figure 1, samples collected over several of years indicate groundwater is consistently of the bicarbonate type with no dominant cation. The geochemical makeup of the leachate sample is sodium or potassium and bicarbonate type. The groundwater plots in a different location than the leachate samples, indicating the groundwater is geochemically distinct from the leachate. The Stiff Diagram in Figure 2 also illustrates the differences in geochemistry between the groundwater and leachate. This type of evaluation can be ongoing to identify potential changes in groundwater geochemistry over time.
Because Stiff Diagrams and Piper Plots are an effective way to show groundwater and leachate are geochemically distinct, we often recommend adding any of the eight geochemical parameters, which are missing from a state’s detection monitoring list, to a facility’s regular semi-annual groundwater monitoring parameter. If an issue develops where an evaluation becomes necessary, historical data is readily available for an evaluation. Additionally, the more historical data available to the evaluation, the stronger that evaluation becomes in identifying potential changes in groundwater chemistry over time.
Stiff Diagrams and Piper Plots are also helpful to compare geochemistry of upgradient and downgradient wells. Often, when changes in geochemistry are occurring in groundwater, they are a result of natural variation within the groundwater system. These changes in groundwater geochemistry are first evident in samples collected from upgradient wells in a monitoring network. Stiff Diagrams and Piper Plots allow for the comparison of changes in geochemistry over time and can demonstrate the geochemistry of downgradient wells is trending more towards that of upgradient wells, rather than that of leachate.
 Landfill Gas Evaluation
If VOCs are present in groundwater samples at a landfill, a leachate impact is often not the cause. Landfill gas impacts to groundwater are a common cause of VOC detections in samples from groundwater monitoring wells. The first (and most obvious) step in evaluating whether VOC impacts to groundwater are a result of a leachate impact is to compare the VOC detections between leachate and groundwater. If the VOCs detected in leachate and groundwater samples are not the same, then leachate is most likely not the cause. As outlined previously, Stiff Diagrams and Piper Plots are an excellent tool for evaluating whether or not VOC impacts are a result of landfill gas or leachate. If groundwater geochemistry is trending towards leachate geochemistry overtime, then leachate is likely the cause of VOC impacts. Changes over time in field parameters such as pH, conductivity, dissolved oxygen (DO), and oxidation reduction potential (ORP) can also provide useful information as to the source of groundwater impacts. Decreasing trends in pH, DO, and ORP, along with the detection of VOCs, are often good indicators of landfill gas impacts, while increasing conductivity can be an indicator of a potential leachate impact.
The VOCs detected in groundwater are often an excellent indicator as to the source of groundwater impact. Cis-1,2-Dichloroethene (cis-1,2-DCE) is commonly detected in groundwater samples where landfill gas migration is occurring. Additionally, VOC detections in upgradient wells are usually a result of landfill gas migration. To further evaluate the potential for landfill gas impacts to groundwater, the collection and analysis of headspace samples from impacted wells can provide information as to the particular VOCs that may be partitioning into groundwater. Air samples are collected from the well headspace in summa canisters and analyzed by EPA Modified TO-14A. VOCs detected in the well headspace samples are compared with VOCs detected in groundwater.
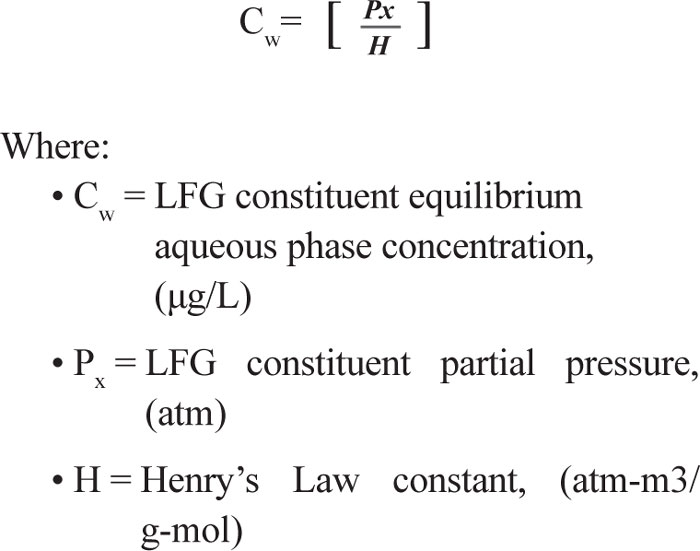
The equilibrium partitioning of chemical constituents between the gaseous and liquid phases is described mathematically by Henry’s Law. Therefore, the transfer of landfill gas (VOC constituents) to groundwater is based in general on the partitioning of VOCs between the vapor phase (landfill gas) to the liquid phase (groundwater). The magnitude of this equilibrium partitioning effect can be calculated using Henry’s Law, which is expressed in Equation 1:
Henry’s Law Constant
Assuming the LFG constituent of concern in this case is cis-1,2-DCE, the Henry’s Law constant can be obtained from the EPA (www3.epa.gov/ceampubl/learn2model/part-two/onsite/esthenry.html). This Henry’s Law calculator estimates the constant by constituent as a function of the water temperature. For this example, a groundwater temperature of 14 degrees Celsius was assumed. At a temperature of 14 degrees Celsius, the Henry’s Constant (H) = 0.00228 atm-m3/mol.
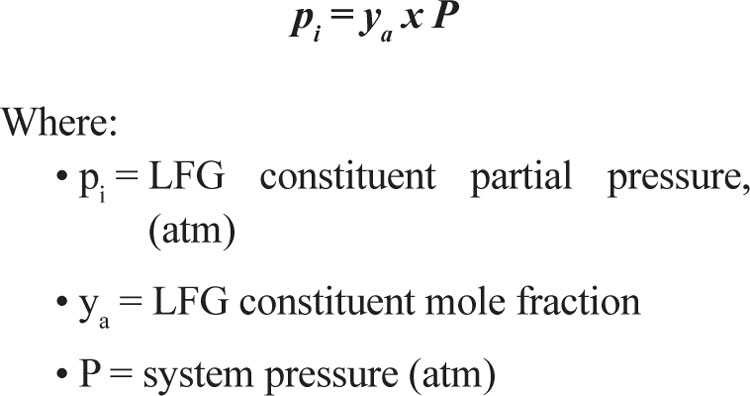
Partial Pressure of cis-1,2-DCE
The partial pressure of the cis-1,2-DCE was estimated using Raoult’s Law with the cis-1,2-DCE mole fraction and assuming standard pressure (1 atmosphere). Equation 2 describes Raoult’s Law. Equation 2
Molecular Weight of cis-1,2-DCE
The molecular weight of cis-1,2-DCE is 96.94 g/mol.
Measured LFG Concentration
For the purposes of this evaluation, a concentration of 22 ppbv of cis-1,2-DCE is assumed to have been detected in the headspace of the impacted well.
Predicted Groundwater Concentration
Based upon the previous information and using Equation 1, the predicted cis-1,2-DCE groundwater concentrations resulting from landfill gas at a concentration of 22 ppbv in direct with groundwater would be approximately 0.94 ug/L. This analysis just includes the contributory component of direct contact between landfill gas and the groundwater. It should also be noted that this type of landfill gas evaluation is generally conducted as part of an ASD.
Native Soil and Bedrock Core Sample Analysis
Another helpful tool to evaluate groundwater chemistry is through the collection of native soil and bedrock core samples for metals analysis. This is most easily done during groundwater well installation, but can be done at any time to provide data, which may demonstrate the presence of various metals in groundwater samples is naturally occurring.
The presence of heavy metals such arsenic, cadmium, chromium and lead, etc., can be naturally occurring, either due to the presence of suspended sediment in groundwater samples or dissolution of metals from surrounding sediments and bedrock into groundwater. Proper sampling techniques are essential to reduce the presence of suspended sediment in groundwater samples. Low-flow sampling techniques or the use of HydraSleeves® are two of the best techniques to reduce suspended sediment in samples. However, reducing the presence of suspended sediment in groundwater samples is not always sufficient to reduce metals concentrations, due to groundwater contact with surrounding sediments/bedrock and partitioning of metals into groundwater. Therefore, the analysis of background soils and bedrock core samples for metals can provide valuable data as to the potential for various heavy metals to be detected in groundwater samples. To further support the evaluation of metals, the use of synthetic precipitation leaching procedure (SPLP) can also be helpful.
The SPLP (EPA SW-846 Method 1312) test uses a similar sampling and extraction process as Toxic Characteristic Leaching Procedure (TCLP, EPA SW-846 Method 1311). The significant difference between the two test methods is the use of different extraction fluids. TCLP was designed to simulate material sitting inside a landfill for a number of years, and then “determine the mobility of both organic and inorganic analytes present in liquid, solid and multiphasic wastes” from the leachate that material would produce. SPLP was designed to simulate material sitting in-situ (in or on top of the ground surface) exposed to rainfall to “determine the mobility of both organic and inorganic analytes present in liquids, soils, and wastes” from the leachate the material would produce. SPLP simulates actual environmental precipitation, and thus the leaching potential of a contaminant in soil. Therefore, SPLP is an appropriate method to assess chemical mobility in the environment, and generally, is a better analysis to evaluate native soil and bedrock for its potential to leach metals into groundwater.
We are currently working with a site with multiple bedrock wells screened through limestone and shale formations. At the time the wells were installed, core samples were collected from the limestone and shale formations and submitted for the analysis of total metals and SPLP metals. Groundwater wells are currently in background monitoring, but metals detections in the groundwater samples are similar to those identified in the bedrock core total metals and SPLP metals results.
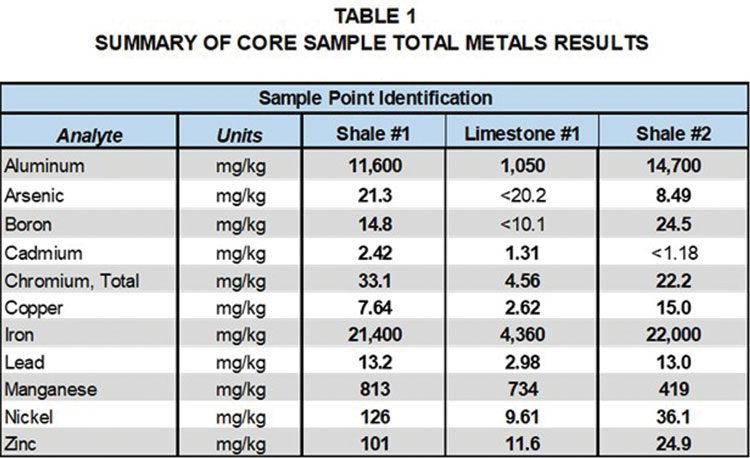
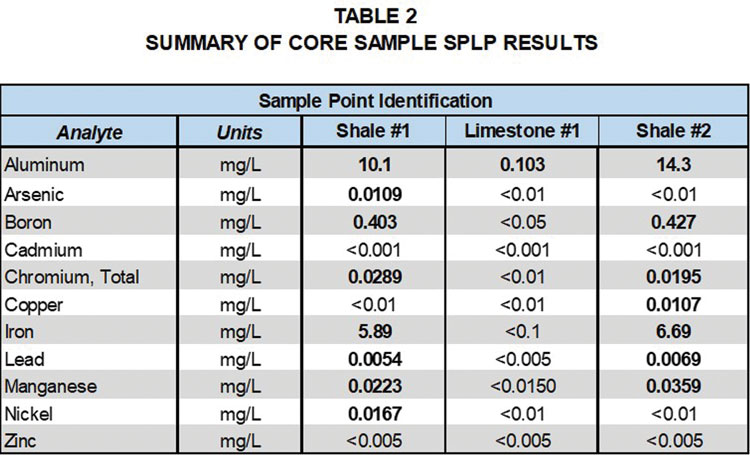
Tables 1 and 2, provide a comparison of total metals and SPLP metals results for the limestone and two shale formation core samples with groundwater samples collected at the site. Detected analytes in the total metals analysis of the core samples included aluminum, arsenic, boron, barium, cadmium, chromium, copper, iron, lead, manganese, nickel and zinc.
It is interesting to note that metals detected in the total metalsanalysis of the shale and the limestone were generally similar; however, concentrations varied significantly. Aluminum was the only metal detected in the SPLP leachate of the limestone, whereas a number of metals were detected in the SPLP leachate of the shale samples. Cadmium and zinc were detected in the total metals results for the core samples, but not in the SPLP leachate. These results indicate that groundwater contact with the shale formations is more likely to lead to metals detections in groundwater samples.
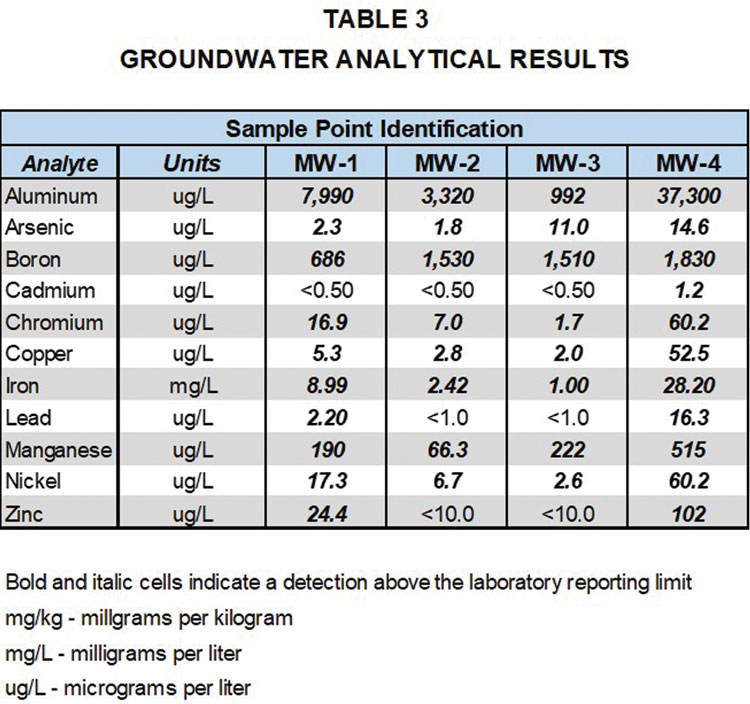
As can be seen from Table 3, each of the metals detected in the total metals results of the core samples were also detected in the groundwater samples, including cadmium and zinc, indicating the presence of these metals in groundwater is likely naturally occurring.
As can also be seen from Table 3, arsenic was detected above its EPA maximum contaminant level (MCL) of 10 ug/L in samples collected from wells MW-3 and MW-4, and lead was detected above its MCL of 15 ug/L in the sample collected from well MW-4. In addition to their detection in the total metals analysis of the shale core samples, arsenic was detected in the SPLP leachate of Shale #1 and lead was detected in the SPLP leachate of both Shale #1 and Shale #2. The total metals and SPLP evaluation of the shale and limestone core samples indicates that the presence of arsenic and lead in the groundwater at concentrations exceeding MCLs is also likely naturally occurring. As additional groundwater data is collected and the site moves from background to detection monitoring, the total metals and SPLP data for the bedrock core samples will be an important part of the ongoing environmental compliance evaluation of metals concentrations in the groundwater samples.
Monitoring Impacts
We have found the implementation of the techniques outlined are very effective in evaluating potential leachate or LFG migration impacts to groundwater at landfill sites, allowing facilities to remain in environmental compliance while significantly reducing the likelihood of a facility to enter assessment monitoring. Additionally, these techniques are protective of the environment, as they aid in the positive identification of leachate and landfill gas impacts to groundwater. | WA
Anne Melia, CHMM, serves as a Senior Project Manager and Senior Chemist for Blackstone Environmental (Overland Park, KS) and is Blackstone’s Health and Safety Program Director. She has more than 30 years of experience providing environmental consulting services to a wide variety of public, private and industrial sector clients. Her project experience includes Phase I and Phase II Environmental Site Assessments; Superfund program activities; Resource Conservation and Recovery Act Subtitle C and D permitting; environmental compliance and monitoring; environmental data validation and statistical analysis; field analytical analysis; National Pollutant Discharge Elimination System permitting; preparation of Spill Prevention, Control and Countermeasures Plans; and hazardous waste determinations. She has been heavily involved in Kansas City area environmental organizations, including the Heartland Chapter of Certified Hazardous Materials Managers, the Green Business Network, the Metropolitan Energy Center and the Johnson County Solid Waste Management Committee. She can be reached at (913) 956-4161, e-mail [email protected] or visit www.blackston-env.com.