A simple comparable metric for tracking your HHW collection program’s effectiveness.
By David Nightingale, CHMM, S.C.
Decision-makers who are responsible to the public for spending their tax dollars often want to know how effective programs are in serving their citizens. When this question is posed to those operating HHW collection programs, it has often been an awkward discussion stemming from the generation pattern of HHW, which is unlike other types of solid waste. Weekly recycling set-out rates and tons per day transfer station throughput metrics rely on time scales that are not appropriate for measuring HHW collection effectiveness.
What would be useful for decision-makers is a simple easy-to-understand metric that objectively describes how an HHW collection program is doing over time. For program managers, it would be helpful to have a metric to not only gage progress, but also to allow direct comparison with other programs. The following metric described can serve both purposes.
Annual HHW Participation Rates Are the Wrong Measure
Local jurisdictions who rely exclusively on HHW collection events often serve 1 to 5 percent of their households per year. Those with well-established year-round collection facilities may see that percentage rise to the double digits, sometimes as high as 14 to 17 percent of households per year. On an annual basis, for those familiar with solid waste metrics, those percentages seem rather low and suggest a small part of the population may be getting served by HHW collection programs.
One of the ways in which HHW is fundamentally different from other types of solid waste is that it has a generation frequency period much longer than annually. Figure 1 shows an example of very old HHW. Therefore, looking at the annual percent of households served significantly under-represents the HHW collection program benefit to the community compared to other solid waste metrics that have generation periods of only weeks or months. So, the obvious question is, “What it the correct generation periodicity for HHW?”
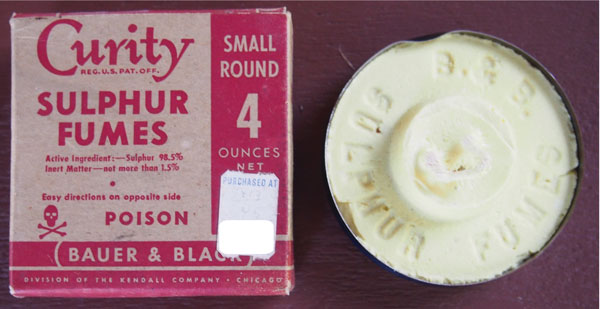
Very old HHW insecticide: “Sulphur Fumes … recommended for combating bed bugs, roaches, fleas, and mosquitos” activated by burning in an evacuated, sealed room.
HHW Generation Periodicity
Most types of HHW have no way to determine their dates of production, sale or use. The major exception to this is architectural paints. Under the 1990 Clean Air Act amendments1, the EPA regulated the amount of volatile organic compounds, VOCs, allowed in architectural paints and required manufacturers to place a date or date code on each consumer and commercial paint container as it is produced. Many paint manufacturers started routinely placing date codes on their products before the 1990 Clean Air Act amendments in anticipation of the legal requirement and for quality control purposes. Consequently, for HHW paints it is possible to establish an approximate date of purchase and use by decoding the manufacturer’s date stamp on their paint containers.
I was part of a national paint product stewardship dialog where the participants wanted to find the age distribution of paint brought into HHW programs. The reason for this paint age study was to gauge whether there were any significant amounts of older vintage paints being delivered to HHW programs that might contain high levels of mercury compounds, which might make this waste designate as a hazardous waste. I worked with local HHW programs to record the manufacturer and date codes on 328 cans of HHW paints. The average age of leftover HHW paint was 7.4 years.2 This paint age study finding that HHW paint has a generation periodicity of 7.4 years means that using an annual performance metric, such as households serve per year, grossly under-represents HHW collection program effectiveness, at least for HHW paints.
HHW Breakdown
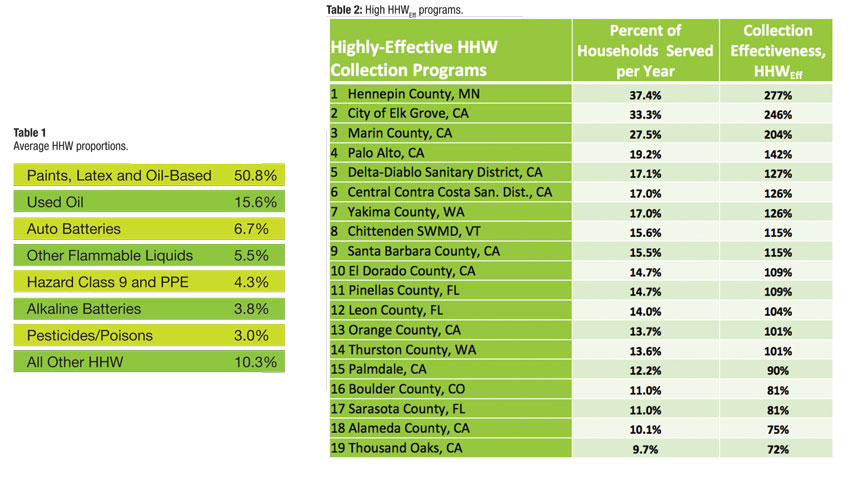
How representative is paint waste generation periodicity relative to other HHW? One way to look at that question is to examine what proportion of HHW are paints. A national survey of 26 programs found that HHW programs average about 51 percent paints, including latex and oil-based varieties. Paints and the remaining largest HHW categories are shown in Table 1.3
Clearly, the paint category dominates all others HHW sub-categories. You could speculate that used oil, as the next largest subcategory at 15.6 percent, probably has a periodicity of generation less than 7.4 years. Whereas, auto batteries at 6.7 percent might be closer to 7.4 years as an average product age. A four- or five-year new auto battery warrantee is common, and batteries often last a bit longer than their warrantee period. However, lacking any hard data to tie any other HHW subcategory besides paints to a generation timeframe, using 7.4 years to be a proxy for all HHW is probably a reasonable approximation. From the paint age study, we know it is representative for at least 51 percent of all HHW.
HHW Collection Effectiveness Metric
It is common for HHW collection programs to track the number of household customers served per year. Combining those annual household participation values with an assumed generation periodicity for HHW of 7.4 years, it is easy to calculate an effectiveness metric for HHW collection as shown below, called the Percent HHW Collection Effectiveness or HHWEff%.
PPR% X 7.4 yrs.= HHWEff%
Where:
PPR% is annual Percentage Participation Rate by households in your service area, 7.4 is the assumed periodicity (average age) for HHW, in years, and HHWEff% is the Estimated Percent Effectiveness of the HHW collection program in a year.4
For example, if the annual participation rate of households in your jurisdiction (PPR%) last year was 7 percent then your HHW collection effectiveness would be:
7% participation rate/year X 7.4 years = 51.8% HHWEff.
A natural follow up question is: “What participation rate corresponds to 100 percent HHWEff%?” If you put 100 percent as the value for HHWEff% into the equation above and solve for the participation rate, you get 13.5 percent. If you are serving 13.5 percent or more of your households per year, you would have 100 percent HHWEff%. More that 100 percent HHWEff% is a reality for some well-established programs that have engendered high levels of participation through aggressive promotion or that serve a citizenry that participate more frequently than average.
Setting and Achieving HHW Collection Goals
If your jurisdiction has 100,000 households and you want to provide 100 percent HHWEff%, you would set a goal of serving 13,500 households per year (100,000 X 13.5%). While serving 13.5 percent of households annual may be a stretch goal for many jurisdictions, some have reached or exceeded this service level. Participation data reported mainly from 2017 operations from jurisdictions with about 10 percent or more annual participation rates are listed in Table 2, along with their corresponding HHWEff%.5
The top three listings in Table 2 represent HHW collection facilities that also take non-HHW recyclables. So those top three values might include some customers who were dropping off recyclables and no HHW. Table 2 does not represent a comprehensive national compilation, so there are very likely high performing programs not listed.
One of the interesting features of the communities listed in Table 2 is that all but three of them are in the top 500 median household income levels out of the 3,143 U.S. counties. Two of the remaining three communities are in the top 1,000 counties, or upper 1/3 income range. Only Yakima County, WA is in the lower range of median household incomes, ranked 2,476th. Kudos to Yakima County for serving their community at a high level without as many well-to-do households.
This income correlation with environmental services is nothing new and points to opportunities to do better for lower income households. To increase social equity, state supported programs could provide funding preference for HHW programs serving lower income jurisdictions.
Using HHWEff% in a Broader Context
In addition to the HHWEff% metric used to track the performance trend of a single HHW collection program, it can also be readily used to compare between HHW programs and even compare between state-wide HHW collection system’s performance. The HHWEff% metric is independent of location, population size, budget or other factors that would otherwise confound direct comparisons between programs. HHWEff% allows apples-to-apples comparisons between different programs serving divergent populations and demographic characteristics. | WA
David Nightingale, CHMM, S.C., is Principal at Special Waste Associates (Olympia, WA), a company that assists communities in developing or improving HHW and VSQG collection infrastructure and operations. They have visited more than 145 operating HHW collection facilities in North America. As a specialty consulting firm, Special Waste Associates works directly for program sponsors providing independent design review for new or upgrading facilities—from concept through final drawings for safer, more efficient and cost-effective collection infrastructures. Special Waste Associates also published the book, HHW Collection Facility Design Guide.
Household hazardous waste (HHW) demands special attention because it represents the most toxic fraction of the municipal solid waste stream. Proper HHW management encompasses a special set of safety, training, design, and policy issues that are separate and apart from other solid waste programs. HHW Corner delves into these unique issues. If you have a question about this article or suggestions for HHW Corner topics that you may like to see covered in future editions of Waste Advantage Magazine, contact David at (360) 491-2190 or e-mail [email protected].
Notes
Section 183(e) of the Clean Air Act, regulates VOC emissions (hazardous air pollutants, HAPs) from consumer and commercial products because they contribute to ground-level ozone associated with human health effects, agricultural crop loss, and damage to forests and ecosystems. From Coatings and Composites Coordinated Rule Development (CCCR) at www3.epa.gov/airtoxics/coat/coat.html.
Nightingale, David, Paint Age Study, presented at Product Stewardship Institute’s Paint Product Stewardship Initiative meeting September 20-21, 2004, Chicago, IL, Northwest Product Stewardship Council’s Paint Advisory Group. The results were peer reviewed by paint industry representatives as being nationally representative.
Nightingale, David, Preliminary National HHW Facility Survey Results, CA Used Oil and HHW Training and Conference, March 9, 2011, CalEPA, Sacramento, CA.
Nightingale, David, Evolution of HHW/CESQG Collection Facilities and Keys to Sustaining Progress, NAHMMA National Conference, Portland, ME, August 30, 2018.
Ibid.