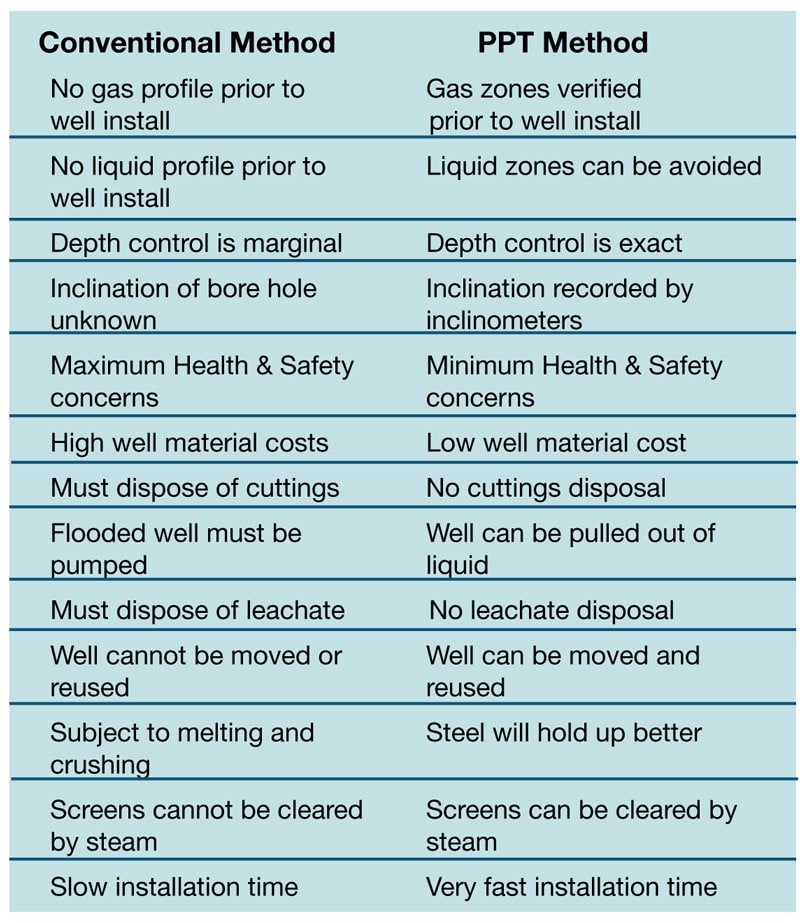
Using the PPT method can provide a more scientific approach to landfill compliance and effective landfill gas recovery. It removes much of the guesswork involved in locating, designing and installing collectors.
By Reg Renaud
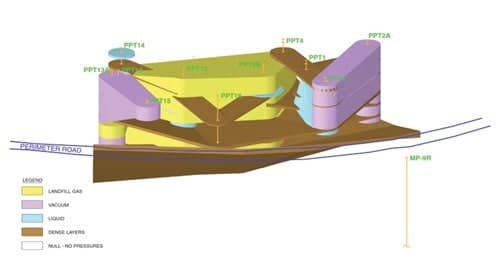
It is well known that decomposition of Municipal Solid Waste (MSW) in landfills produces methane gas and other trace toxic gases (e.g., polyvinyl chloride, PCP, etc.). It is necessary to prevent this gas from escaping into the atmosphere to stay in compliance with current Federal and State air pollution prevention regulations. It is also important for landfills located near structures (residential/commercial) to prevent methane from migrating to the structures and causing a potential explosive condition. Finally, uncontrolled landfill gas (LFG) migration at sites with shallow groundwater can result in contamination of the water source, which can cost the landfill owner/operator many millions of dollars for cleanup and abatement (see Figure 1).
Today, the standard practice for LFG control is to install gas extraction wells or gas collectors, based on information obtained from grid walk monitoring of gas seepage from the landfill surface and from probes installed at widely spaced intervals around the landfill perimeter. Once it is determined that a gas extraction well or collector is to be placed, it is installed using several drilling methods such as hollow stem auger, bucket auger or air rotary, or by the horizontal trench method. For vertical wells, the well casing may vary in diameter from 4 inch to 24 inch and the depth will also vary. Most well casings are at least 4 inch in diameter, in order to accommodate a submersible pump to remove leachate, which enters the collector through the screen and floods the well and stops the flow of gas into the well. This leachate must then be either treated, disposed of offsite or re-circulated into the landfill.
Vertical collectors are typically screened or slotted from near the bottom to within about 10 feet from the surface because it is generally not known at what level the gas will be located. Installing the screen so close to the surface can result in air infiltration into the gas stream unless the flow rate is restricted by a control valve. Also, the screen section and surrounding sand/gravel pack can act as a conduit for perched leachate to flow down to the bottom of the landfill where it may impact the groundwater. The main reason these collectors are at least 4 inches in diameter is to accommodate pumps, because it is not known prior to construction if the collector is being installed through a perched liquid layer or not. The standard drilling methods cannot typically locate thin layers of perched water, which may impact the collectors after installation.
To eliminate these problems a method has been developed to determine if the location selected for a collector is suitable for gas extraction and has little leachate, which will effect the production of the collector. To determine where to install collectors, it is necessary to profile the trash prism and outline where the gas pockets are and where perched leachate exists, which should be avoided. It is also necessary to map out the existing vacuum influence from nearby collectors to ensure full coverage of the landfill.
The following outlines the development of the use of the Piezo-Penetrometer Test (PPT) and cone penetrometer test (CPT) for profiling of gas pressures, perched liquid, vacuum zones and dense cover soil layers in landfills and the use of the acquired data for location and design of LFG collectors. Design and construction of LFG collection systems based on this in situ data can be significantly more effective and efficient. Based on this in situ data it can be determined if Push-In steel collectors or Internal Conduits should be installed for increased gas recovery.
The Procedure
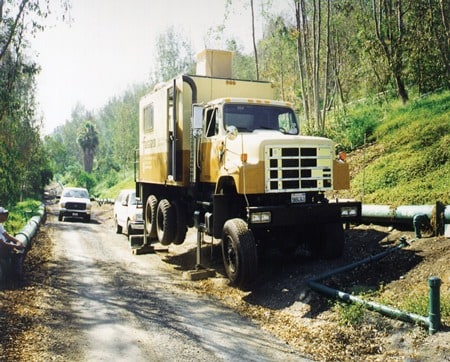
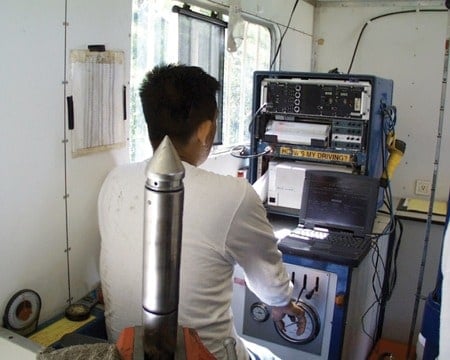
The PPT was developed in the late 1970s and early 1980s. At the time, the primary purpose of this device was to measure the pore pressure in the soil to determine the level of the ground water. The PPT cone is pushed into the landfill by hydraulic rams mounted on a 20-ton truck (see Figure 2). The cone is advanced by adding 1-meter long push rods pre-threaded with a cable connecting the cone to a computer, which digitally records and displays in real time several parameters continuously during the sounding (see Figure 3). The PPT cone measures tip resistance and sleeve resistance (useful data for soil type, strength and foundation design) the same as a standard CPT (ASTM 1988). The instrument has inclinometers to determine that the cone is staying vertical during advancement through the subsurface or landfill, which adds to the accuracy of the depth control. The depth control of the sounding is very exact (via an encoder attached to each advanced push rod segment).
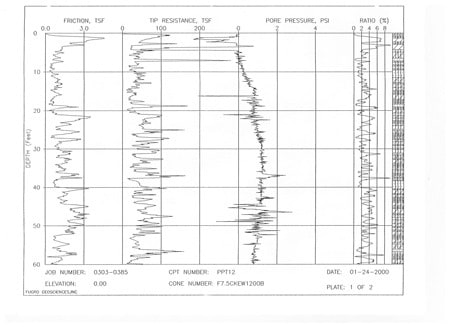
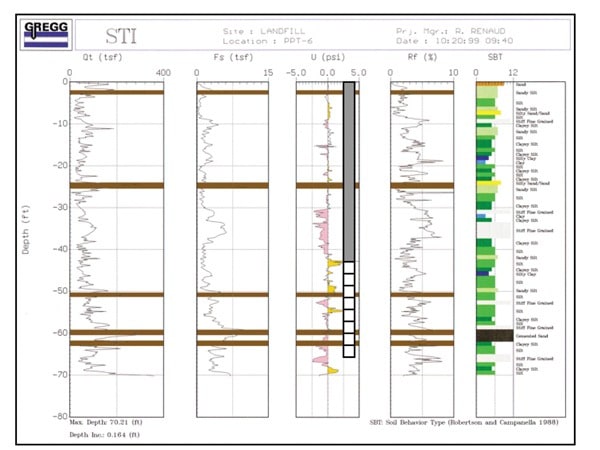
The following is a brief description of each column displayed on the log (Figure 4):
- Column 1—Depth of sounding in 10-foot intervals.
- Column 2—Friction sleeve values as the PPT cone is advanced through the landfill. The values are presented in tons per square foot (tsf). The friction values are useful in determining a friction ratio, which is used to identify the type of material the cone is passing through. It is also an indicator of moist conditions in the landfill.
- Column 3—Tip Resistance or End Bearing (tsf) values indicate the relative density of the material the cone is penetrating. This value is also used in the friction ratio calculation. The high tip resistance readings can indicate dense layers or daily cover layers and the low tip values usually indicate refuse.
- Column 4—Pore Pressure values (psi) can measure gas pressures, vacuum and liquid head pressure. On the above PPT log, the Pore Pressure values begin to increase in pressure at a depth of 5 feet below ground surface (bgs) and continue to increase to about 1 psi of gas pressure all the way to 60 feet bgs.
- Column 5—Friction ratio (%) is calculated by dividing the friction sleeve value by the tip resistance and is presented in a percent. In soils, friction ratios of less than 2 percent typically indicate sandy or gravelly soil behavior types, and the higher the friction ratio, the more “clay-like” the material (Robertson and Campanella 1988). Moist municipal solid waste has been found to generally have friction ratios greater than 2 percent.
There are basically two configurations of the PPT cone, one is a tip-sensing unit, which has the pressure transducer placed in the tip, and surrounded by a porous element to allow liquid or gas to enter the transducer chamber. The second configuration is the side-sensing cone, which has the pressure transducer behind the tip of the cone and the porous element is a ring located behind the tip as well.
Different pressure transducers with many different pressure ranges can be used in either configuration. If high pressures are anticipated, a transducer that operates as high as 1,000 psi can be installed. If low pressures (e.g., less than 10 psi) are anticipated, a very sensitive transducer can be used to provide greater resolution. The tip-sensing cone is very responsive to changing pressures because it operates in the positive mode caused by dynamic forces as the cone is advanced through the soil. However, the porous element on the tip-sensing cone is more vulnerable to damage when being pushed through dense material often encountered in landfills. The side-sensing cone is typically used for landfill profiling because it can be pushed through the dense layers of refuse without damage.
The PPT log in Figure 5 indicates a hydrostatic slope from 8 feet bgs to 40 feet bgs. It is historically known that when this area of the landfill was constructed there was an intermediate cap over phase 1, placed at 40 feet bgs. The second phase of the landfill was filled during the rainy season trapping liquids. Note the gas pressure reading between 40 feet and 60 feet that is trapped under the intermediate cover and the liquid.
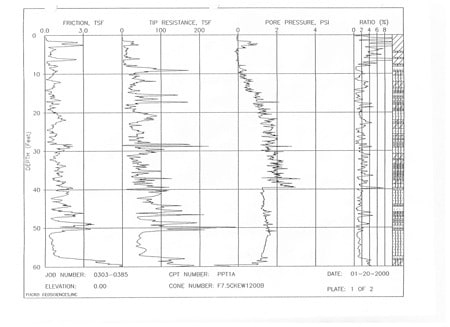
The horizontal collector in the immediate area and below the 40-foot dense layer was not functioning properly and not recovering the gas causing a possible pathway to a nearby impacted probe. If a vertical collector had been installed at this location it would have flooded and transmitted this liquid to the bottom of the unlined landfill.
Typically, as a PPT sounding in a landfill progresses, the side-sensing transducer indicates a slight apparent/dynamic vacuum (e.g., 1 to 5 psi) as the porous element passes through dry layers of refuse or daily cover soil. When the sounding is stopped to add another push rod (standard length 1 meter), the vacuum reading typically returns to zero. It is during this pause that a vacuum zone induced by the LFG collection system will be registered as the induced vacuum increases away from the zero line in Figure 6 (usually the PPT reading is practically the same as the vacuum gauge reading attached to a nearby collector).
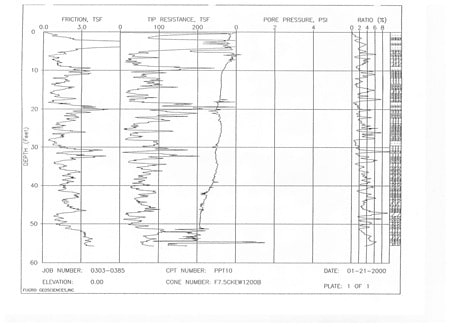
If a PPT is being performed within 40 feet of an existing collector, the vacuum should be increased so that the vacuum will be very apparent if it is encountered in a zone in the PPT sounding and assist in determining the zone of vacuum influence. Figure 6 presents a record of measured vacuum confirmed by vacuum gauge readings on a nearby LFG collector.
If a zone of gas pressure is encountered during the sounding, which is high enough to overcome the small dynamic vacuum, the pore pressure readings will increase and a stabilization test should be performed to measure the static pressure. To clear the porous element and to verify the pressure reading, the cone should be pulled up slightly to initiate the stabilization test. Interpretations of the tip resistance and friction ratio data are made to determine locations of dense daily cover/soil layers, buried access roads or berms, and the bottom of unlined landfills. Sharp increases in tip resistance combined with friction ratios in the range of sandy soils (e.g., < 2 percent) indicate soil layers within the MSW profile. Typically, gas pockets are found just below a dense soil layer and above a liquid zone. Liquids are frequently found perched above very dense layers.
It has been observed that the average tip resistance in a landfill can give an indication of the density of the refuse and the permeability of the material. This information is useful when designing a LFG collection system. Further study of the tip and sleeve resistance and the correlation to MSW density is required.
Data Display and Interpretation
Following a group of soundings being performed in an area of a landfill, the data (i.e., location, depth, pressures, vacuums and dense layers) is inputted into Auto Cad and Micro Station or similar programs to produce a 3-D profile of the conditions in the area of concern. Also, plan-view and cross sectional displays of the data can be easily generated.
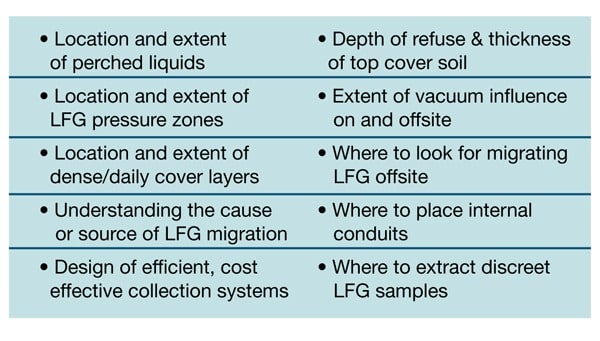
The PPT soundings must be performed in a box type formation to provide depth to a 3-D profile. It is necessary to survey the elevations of the surface of each PPT sounding to provide a reference to each of the PPT locations in the 3-D Profile. The 3-D Profiles or cross-sections and plan views are then evaluated to provide information on:
Another important parameter to measure is the thickness of the cover soil on the final elevation of an active landfill and especially a closed one. The PPT has been called into use by local water boards to determine why the groundwater around closed unlined landfills with substantial caps on them to prevent water infiltration. The PPT was used to measure the thickness and the density of the cover soil, which also measured the gas pressure under the cover and all through the waste prism to the bottom. More importantly, the PPT also measured the density of the native bottom soils. It is not unusual to see 600 tons/square/foot (tsf) density on the cap and only 200 tsf density for the native bottom soils. With no vents or gas collection system in the waste prism, the gas took the path of least resistance to the ground water.
Following the profiling of a landfill, the data is used to develop a remediation plan to address the gas plumes and other issues required for the landfill to stay in compliance or to recover gas for beneficial uses (e.g., generation of electricity, CNG or liquefied gas alternative fuel). With the location of the gas plumes mapped out and with the knowledge of where the perched liquids are located, it is easier to avoid placing collectors through a perched zone, which will flood the collector.
One of the most important benefits in using the profiling technique is to prevent installing a collector through a perched liquid zone and providing a conduit for the liquid to migrate to the bottom of the landfill and leak to the ground water or flood the well. The extraction well screen is placed only where the indicated gas plume is known to be and not in liquid containing zones. This method eliminates the high cost of pumping hazardous leachate.
Another costly mistake with drilled in collectors is to install a $10,000 to $50,000 collector, depending on depth and find that there is already vacuum in this area. This is just as bad as drilling through a liquid layer—the PPT can prevent this.
Push-in Gas Collectors
Following a PPT, sounding the CPT rig can be used to hydraulically push steel collector pipes into the waste prism at the best location for LFG extraction. Schedule 80, black steel oilfield mill slot segments (which are a proven oilfield well design for more than 150 years) with slot sizes (0.01 inch to 1/8 inch and 3.5 inch long are staggered) can be installed. The blank risers are schedule 80 black pipe threaded and coupled. A typical 50-foot deep installation takes approximately 30 to 40 minutes to complete.
The main cause of well screen plugging is from liquid flowing into the collector, carrying silt, which blocks the sand/gravel pack and the well screen in drilled-in wells. Since push-in gas collectors are not installed in liquid zones using the PPT profiling method, it is not necessary to install a 4-inch collector to accommodate a submersible pump. If the screen should become plugged, high-pressure steam can clear the screens in minutes.
It is much more cost effective to install a 2-inch diameter steel pipe and well screen. If over time liquid should migrate to the well screen and flood the collector, it is a simple process to hook a chain to the top of the steel collector and, with a backhoe, pull the collector up a few feet out of the liquid and re-seal at the surface.
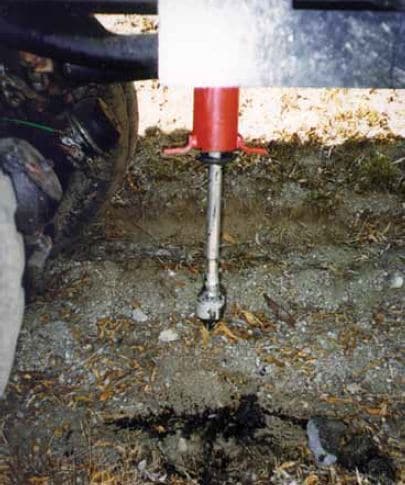
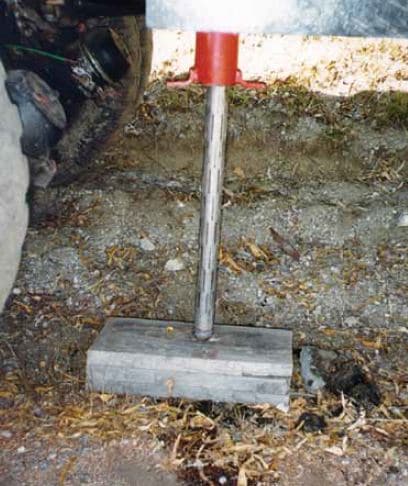
It is even more cost effective if the push-in wells are installed immediately following the PPT. The data being produced in real time can be used to design the collector immediately while the CPT rig is still over the location. Since a pilot hole has been provided by the PPT, the hole is expanded to a 3-inch diameter by a 3-inch diameter mandrel (see Figure 7) and a 2-inch collector can be installed very rapidly (see Figure 8). This also saves the time spent grouting up the PPT hole and coming back later to pre-punch a pilot hole for the collector. No cuttings are produced in the push-in method—a huge time and cost savings.
The use of these procedures will drastically reduce the operating and maintenance costs of landfills and assist in maintaining regulatory compliance. Advantages of the PPT method over conventional drilling methods are as follows:
Internal Conduits
As stated previously, it is not uncommon for the PPT soundings in waste prisms with an existing LFG collection system to encounter an induced vacuum from a nearby existing collector and gas pressures in the same sounding. As expected, due to variations in density and permeability, the zone of vacuum influence around a typical LFG collector in MSW looks like a series of fingers rather than a uniform sphere (see Figure 9).
When this condition is encountered it is not always necessary to install another collector to improve the vacuum influence. Rather a 3/4-inch perforated PVC pipe can be installed using push-in methods, which connects the vacuum zone(s) to the gas pressure zone(s). A GMF casing with a dummy tip is pushed to the target depth. A 3/4-inch perforated PVC pipe is inserted down the GMF casing. The GMF casing is then retracted leaving the dummy tip and internal conduit in place. The gas pressure now has a pathway to the vacuum zone and to the collector. Once the conduit is installed at the correct depth, the top of the PPT hole is grouted up. This method can increase gas recovery from existing collectors by as much as 50 percent. The cost can be $5 to $10 per foot.
Conclusion
The use of the PPT method described in this paper can provide a more scientific approach to landfill compliance and effective landfill gas recovery. It removes much of the guesswork involved in locating, designing and installing collectors. | WA
Reg Renaud is President of STI Engineering, Inc. (Silverado, CA) and has been involved in the geotechnical and environmental industry for 37 years. He has been developing in-situ technology for landfill investigations and the Landfill Gas Profiling Method since 1984. He holds patents for Steam Injection in landfills and for Steam Injected Biomass Reactors, a more advanced anaerobic digester. Reg can be reached at (714) 649-4422 or visit www.airspacerecovery.com.
References
American Society for Testing and Materials, 1988, “Method for Deep, Quasi-Static, Cone and Friction-Cone Penetration Tests for Soils”, ASTM Standard D 3441-86.
Robertson, P.K. and Campanella, R.G., 1983, “Interpretation of Cone Penetration Tests-PART I (SAND) and PART II (CLAY)”, Canadian Geotechnical Journal, Vol. 20, No. 4.
www.airspacerecovery.com – Landfill Compliance – 2000 – Reg Renaud.
Figures courtesy of STI Engineering.