Waste-by-Rail
Rail Freight Traffic: A Leading Economic Indicator
Emerging market opportunities are important to the recoupment of the railroads traffic base. Waste, scrap and related commodities are a small part of the overall rail traffic base but are seen as growth areas to railroads.
Darell Luther
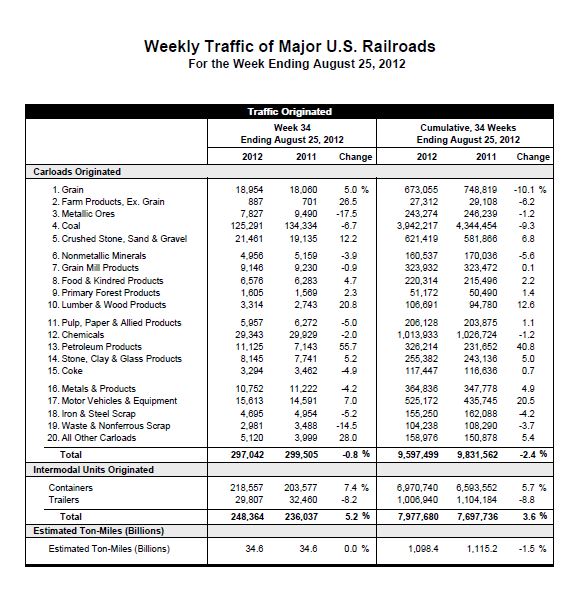
It’s often quoted in the economic sectors that rail freight traffic is a leading indicator of future economic health of our country. The rail freight traffic indicator most closely watched is weekly originated rail carload traffic trends of major U.S. railroads. Weekly originated carloads are tracked in 19 commodity groups and one all other category (see Figure 1). These originated rail carloads are the originated shipments categorized in each commodity group that are moved via rail in the United States, a count, if you will, of new commodity movement by rail.
Waste & Nonferrous Scrap and Iron & Steel Scrap play a small yet important role in the rail freight indicator world. It’s telling as a downstream indicator in the basket of originated rail carload indicators that if these commodities are doing well the economy has stabilized and economic recovery tends to be more imminent.
Overall, there were 9,597,499 rail carloads originated in the cumulative 34 weeks ending August 25, 2012 and Waste & Nonferrous Scrap and Iron and Steel Scrap comprised 259,488 of the rail carloads or 2.7 percent of the total originated rail carloads. This may seem like a small piece of the overall pie but according to economist and Bloomberg Brief contributor, Michael McDonough, there is an 82.4 percent correlation between the U.S. gross domestic product and waste and scrap originated rail carload shipments. This is the highest correlation of any commodity group depicting a reliable prediction of the country’s future economic health.
Waste & Nonferrous Scrap reflects a decrease of 3.7 percent in originated rail carloads from the cumulative 34 weeks ending August 25, 2012 compared to the same time frame ending 2011 which reflected 108,290 railcar loads and in 2012 reflected 104,238 railcar loads.
Iron & Steel Scrap reflect a decrease of 4.2 percent in originated rail carloads from the cumulative 34 weeks ending August 25, 2012 compared to the same time frame in 2011 which reflected 162,088 railcar loads and in 2012 reflected 155,250 railcar loads.
The Commodity Basket
Looking back at the cumulative 34 weeks ending August 25, 2012 (www.aar.org ), freight carloads originated are at 9,597,499 down 2.4 percent, or 234,063 carloads, from the same time period in 2011. The losses are led by coal at minus 402,237 originated carloads and in second place is grain at minus 75,764 originated carloads. It is not surprising that the leader in the gain side of the equation is petroleum products at plus 94,562 originated carloads followed closely by motor vehicles and equipment at plus 89,427 originated carloads. The third place gainer is crushed stone, sand and gravel with plus 39,553 carloads. Of interest to economic measures is that lumber and wood products are trending up with a positive gain of 11,911 carloads when compared to the same 34 weeks in 2011. The balance of the commodities is somewhat stagnant when comparing originated carload statistics.
So what does this tell us about the U.S. current and future economic health? Let me first qualify this question with what I’m about to espouse. I’m no economist. If we segregate these carload origination indicators into two broad categories reflecting better economic times and two broad categories reflecting worse economic times we get a better picture of the economy and what’s likely to occur in the future.
Upside Indicators
Basic Industries
On the growth side, one will see the petroleum industry is driving growth in crude oil shipments and considering the time, cost and political agenda that it takes to get a pipeline in place will continue to do so for the foreseeable future. Notwithstanding originated rail carloads, a pipeline may cause some downside if we don’t increase refining capacity by simply moving supply closer to a chokepoint. This industry is also partially supporting growth in stone, sand and gravel shipments in the developments of infrastructure for drilling and accommodations for workers.
Consumer Confidence
Outside of basic industries it’s somewhat surprising to see motor vehicle growth up so significantly. This tells me there was either pent up demand that was held back during the early recession of 2009 – 2010 or we’re gaining consumer confidence. I’m hoping it’s the later but we’ll see if the numbers continue to be supported. Lumber and wood product shipments are up 11,911 railcar loads and are a reflection of a solid upswing in housing starts. This upswing should transfer through to slight increases in the waste management business as well as housing starts reflected in June 2012 are at 760,000 up from 711,000 from the same time last year and the highest since 2008. This should translate into a better waste stream at some point in the future.
Downside Indicators
Weather
We have some 40 states in drought condition in the U.S. That has a major effect on the small grains and whole grain supply. The number one feed grain is corn in this country and although it isn’t harvested yet is projected to be significantly less than projected in January of this year. It may end up at a record low harvest. The largest impact corn has is the price of foodstuffs and protein feeding. In addition, it may have an effect on gas prices as when distilled into an ethanol additive. There’s nothing we can do about weather but deal with it the best we can in our individual situations.
Competing Products and Politics
Coal originations are off some 400,000 railcar loads. Coal accounts for the single most carloads of any commodity transported by rail. It pays for the infrastructure of the rail systems in this country. Coal is being affected by natural gas prices being low and projected to remain so for the near future. However, if left to normal capitalistic pricing, coal and natural gas will eventually find a price and supply equilibrium that is beneficial to the consumer. Coal is also being negatively affected by political agendas and special interest groups as well.
So what do all these indicators have to do with the waste by rail options for waste and scrap materials? On the plus side as basic industries gain traction and consumer confidence ticks upward, we move into different weather patterns, and as energy policies and politics shake out we, as general consumers and producers of goods and services, generate more waste and scrap materials. This theoretically creates more demand for transportation options. At this time if the correlation between waste and scrap material rail carload originations and the gross domestic product hold, we see a slight wavering of economic stability and economic recovery. However, it’s a perfect time to negotiate logistics options as capacity is available in many sectors.
Explore Rail Options
Emerging market opportunities are important to the recoupment of the railroads traffic base. Waste, scrap and related commodities are a small part of the overall rail traffic base but are seen as growth areas to railroads, particularly at times like these when there are high fixed cost assets (rail and track infrastructure) not being fully used.
In the September edition of Waste Advantage Magazine, we wrote on Using Rail to Transport Waste – Quantifying the Economics. In that article we espoused quantify your rail economics by putting together the pieces (origin, rail, unload) of the jigsaw puzzle. Judging by the rail traffic carload originations, it appears that the railroads could use the business and should be somewhat amenable to discuss opportunities with new customers or customers bringing on new business.
Darell Luther is president of Forsyth, MT-based Tealinc Ltd., a rail transportation solutions and railcar leasing company. Darell’s career includes positions as president of DTE Rail and DTE Transportation Services Inc., Fieldston Transportation Services LLC, managing director of coal and unit trains for Southern Pacific Railroad and directors positions in marketing, fleet management and integrated network management at Burlington Northern Railroad. Darell has more than 24 years of rail, truck, barge and vessel transportation experience concentrated in bulk commodity and containerized shipments. He can be reached at (406) 347-5237, via e-mail at [email protected] or visit www.tealinc.com.
Figure 1
Emerging market opportunities are important to the recoupment of the railroads traffic base. Waste, scrap and related commodities are a small part of the overall rail traffic base but are seen as growth areas to railroads.
Figure courtesy of the Association of American Railroads.