Diligent safety programs, HHW- specific HAZWOPER training, and performance benchmarking are keys to efficient and safe HHW collection operations. Planning for 10 percent or better annual participation rates for HHW collection is a reasonable goal for most local programs and all states.
By David Nightingale, CHMM, S.C.
This month will be the last issue HHW Corner column as the North American Hazardous Materials Management Association (NAHMMA) will be writing in this space going forward. I am confident that they will continue providing interesting and valuable information to the Waste Advantage Magazine audience.
First Last Thing
The first edition of this column appeared in January 2020. I initially proposed a six-part series focusing on HHW collection facility design. Working with the publisher, Angelina Ruiz, we extended the scope and duration of this column for the last two and a half years. I need to thank Angelina Ruiz, her staff, and the editorial advisory board for their unflagging support during the last 30 months. Before signing off, I want to touch on two other “Last HHW Things”.
Second Last Thing: Managing HHW and VSQG Wastes Safely
I am one of the co-authors of the completely rewritten 24-Hr. HHW/VSQG Collection Operations Training Manual, 3rd Edition, which will debut at the NAHMMA’s 37th Annual National Conference to be held July 17 – 22 at Fort Myers, FL. SWANA provides certification associated with this training as well as occasionally offering this training. Safety while collecting and managing HHW is a big deal, and this training is a fundamental baseline for anyone responsible for HHW operations, staff, and management.
Over the past 30 years, I have observed operations at more than 150 HHW collection facilities in the U.S. and Canada and seen all manner of operations—some safer than others. In addition, there have been a few injury surveys regarding HHW operations. It is clear to me that many worker injuries at HHW facilities are not that different from other commercial/industrial workplaces.
OSHA works to prevent workplace injuries. The top 10 list of most frequently cited OSHA standards violations provides insight into the most common workplace safety issues: www.osha.gov/top10citedstandards. The top 10
OSHA citations includes five that are especially applicable to everyday operations at many HHW/VSQG collection operations. Those five are:
1. Hazard Communications Standard—A broad requirement to inform workers of workplace hazards and one of the drivers for the NAHMMA 24-Hr. HHW/VSQG Collection Operations Training mentioned previously. See (29 CFR 1910.1200) [related safety resources].
2. Respiratory Protection—The presence of toxic fumes and particulates is a common hazard while packing and consolidating HHW. See (29 CFR 1910.134) [related safety resources].
3. Fall Protection Training—A general hazard at many workplaces and slips, trips, and falls is a real hazard at HHW collection operations. See (29 CFR 1926.503) [related safety resources].
4. Eye and Face Protection—Should not be taken for granted when handling chemicals and safeguards are easy to employ. See (29 CFR 1926.102) [related safety resources].
5. Machinery and Machine Guarding—Includes crushing equipment, power tools, and other machines that make HHW collection opeations easier on the body but also require ongoing awareness and following safety procedures during use of machinery. See (29 CFR 1910.212) [related safety resources].
This is not to diminish the need to pay attention to other hazards common to waste handling operations such as vehicle collisions, improper lifting, repetitive motion, noise exposure, and unanticipated chemical reactions, that are specific to some HHW collection tasks. However, be sure to keep your eyes on the highlighted and underappreciated top 10 issues as well.
Last Last Thing: Benchmarking HHW Programs
There have been a few studies to examine trends in HHW collection during the past few decades. I presented the findings from the last such national study 10 years ago this month at the NW NAHMMA Chapter Conference in Spokane, WA. Although waste management methods typically do not change quickly, it may be about time to implement another national study of current HHW collection trends. Until that happens, the following statistics from that last survey provide some benchmarking information, which you may find useful in comparison to your state or local programs.
Context and Scope of National HHW Collection Facility Study
The survey focused on information from relatively mature HHW collection programs—those programs with permanent HHW collection facilities that had been operational for at least six years as of 2010. The design and implementation of the survey was led by HHW managers from Kitsap County, WA, Sarasota County, FL, Scott County, MN, and myself.1
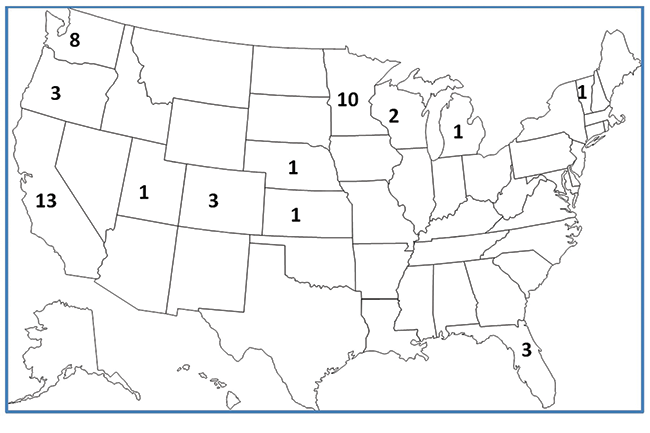
Distribution of Survey Respondents
Twenty-six local jurisdictions provided complete survey data. The service area populations ranged from 21 thousand to more than 2 million and population densities ranged from 17 people per square mile to 17 thousand people per square mile. Completed surveys returned by state are shown in Figure 1. This shows a bias for the middle and western parts of the U.S. That regional bias matches states where there was a larger preponderance of mature collection infrastructure in the U.S. This geographic survey bias does not concern me much because the traditional types of HHW received and range of common handling practices varies little between facilities across the US.
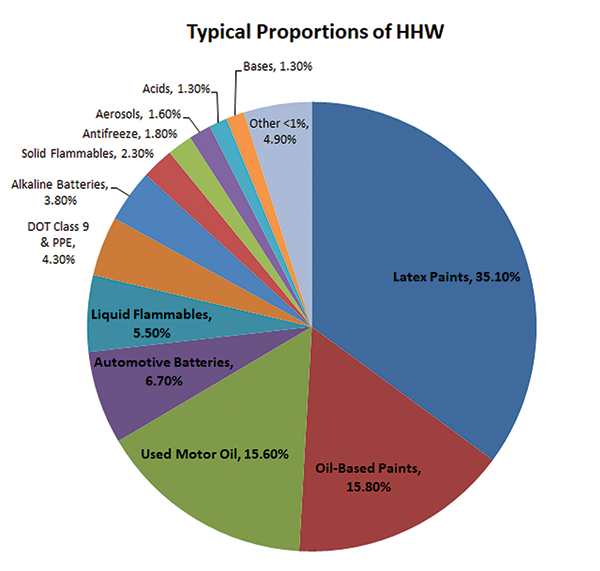
Typical Distribution of HHW Waste Types
Proportions of the traditional types of HHW collected are shown on Figure 2. There are variabilities in these percentages from place to place. However, the relative preponderance of waste types is common. For instance, paints and used motor oil are typically at the top of most collection program lists. However, these proportions can vary significantly depending on local conditions. For instance, if your program does not take latex paints or you can rely largely on a system of convenient used oil collection points for that waste type, the proportions of HHW types you collect will vary accordingly. Other HHW-related wastes were not included such as e-waste and biohazard wastes.
Population Density and Pounds Per Participant
Three demographic population density categories showed different amounts and variability of HHW collected per household participant. The demographic categories were: Urban, where there were greater than 500 people per square mile, Suburban, between 200 and 500 people per square mile, and Rural, with less than 200 people per square mile. The variability in amount of HHW collected per participant based on population density is shown in Table 1.
The low end and average values for suburban programs at 68 pounds and 93 pounds per participant was surprisingly high. This might simply be that suburban households with larger properties buy more hazardous products and dispose of larger quantities of HHW than either small lot urban residents or rural homeowners. The survey answers the what but not the why. The take away here is that suburban programs are likely to receive larger loads of HHW than urban or rural collection programs.
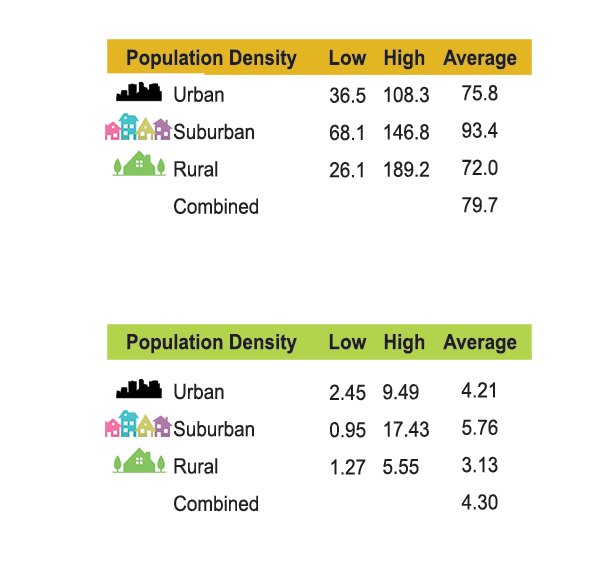
Bottom: Table 2: Annual pounds of HHW collected divided
by all households.
Tables and Figures courtesy of Special Waste Associates.
Annual Pounds per All Households
Another way to parse the data is to divide the total pounds of HHW collected in a year by the total number of households in the service territory. The survey yielded the results in Table 2, page 19. It is interesting to compare these results to estimates for HHW annual generation (see HHW Generation Rate is Elusive sidebar to compare those estimates).
Household Participation Rate: Benchmarking to Other Programs
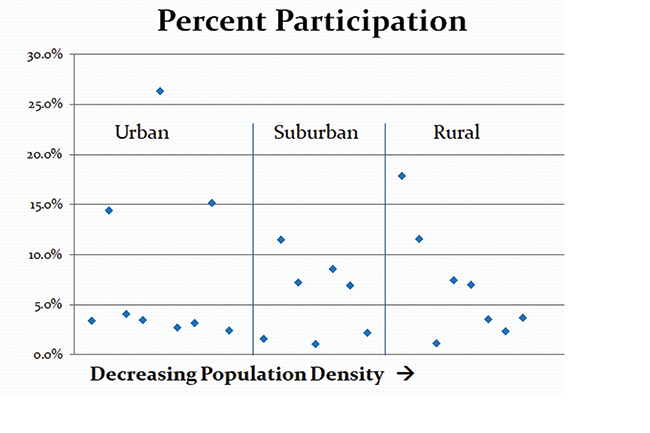
Perhaps the most telling performance statistic is the proportion of households per year that take advantage of HHW collection opportunities in your jurisdiction. The annual participation level is measured by the percent of households in the service territory served per year.
Interestingly, from the national survey there was no clear division of participation levels by population density. This is shown in Figure 3. The underlying population density of urban, suburban, and rural does not appear to influence the level of local annual participation rates for HHW collection at well-established facilities. You may realize relatively high or low participation rates regardless of population density.
Figure 2 also shows that most long-standing permanent HHW collection programs engender between 2 percent and 10 percent annual household participation per year. However, there are relatively high-performing local programs, those routinely exceeding 10 percent annual household participation levels, in urban, suburban, and rural areas.
Using Participation Rate to Gage HHW Collection Effectiveness
Your level of household participation rate can be compared to the suggested 100 percent HHW Collection Effectiveness level of 14 percent annual household participation rate. This HHW Collection Effectiveness metric was discussed in detail in the November 2020 HHW Corner article (https://wasteadvantagemag.com/hhw-collection-effectiveness-metric/).
Fourteen percent or better annual household participation rates probably sound high to many HHW managers. However, there are more than a few examples of local programs that consistently reach the 14 percent annual participation level. These high-performing programs include Chittenden Solid Waste District in Vermont, Hennepin County in Minnesota, Pinellas County in Florida, Yakima County in Washington, and at least seven city or county run programs in northern California.
Only communities with permanent HHW collection facilities see double digit annual participation rates. Most communities that provide only periodic temporary HHW collection events see participation levels in the 1 percent to 4 percent rate.
States where most counties have one or more permanent HHW collection facilities reflect HHW participation levels well above the temporary collection event only performance levels. For example, California and Washington usually see statewide HHW collection rates of 6 to 8 percent of households participating annually. In 2019 Washington State’s pre-pandemic HHW collection participation rate was 7.7 percent, yielding a statewide 57 percent HHW Collection Effectiveness. States in which HHW programs rely primarily on occasional collection events have much lower levels of participation and effectiveness. Planning and striving for 10% or better annual participation rates for HHW collection is a reasonable goal for most local programs all states.
Final Words
I have enjoyed the opportunity to provide a monthly window into the people and programs that have been influential and continue to advance the profession and programs associated with HHW policy and management in North America. I look forward to reading the continuing evolution of this column as the North American Hazardous Materials Management Association steps up to provide articles in forthcoming issues of Waste Advantage Magazine. | WA
HHW Generation Rate is Elusive
Unlike major components of the solid waste stream, the percentage of HHW in solid waste is small and very challenging/expensive to accurately measure. Nonetheless, various estimates have been made and can be useful in describing the magnitude of the HHW problem.
Depending on your source, the estimated amount of HHW generated per year per household varies. It is 30 pounds according to the EPA’s Pollution Prevention Toolbox1 and North Carolina Department of Environmental
Quality.2 However, it is 4 pounds per household per year for Pennsylvanians according to their Department of Environmental Protection.3 If you prefer using EPA Region 9 estimates (serving AZ, CA, HI, NV, and Pacific Islands) they pegged the number at 20 pounds of HHW generated per household per year.4
Most of these estimates were created in the 1990s and suggest a range of likely HHW generation rates. The one earlier published estimate I am aware of was a range of 7.5 to 20 pounds per household per year with a national average of 15 pounds published in 1989.5
It may be useful for public understanding to use one number, or a range of estimates cited here. However, these estimates are not as useful for program planning or implementation. Actual historic HHW collection statistics from your service area, or a nearby peer jurisdiction, will be more useful to understand the magnitude and proportional mix of HHW types when planning for future collection and management.
Notes
https://deq.nc.gov/about/divisions/waste-management/solid-waste-section/household-hazardous-waste
https://archive.epa.gov/region9/waste/archive/web/html/house.html#:~:text=The%20average%20U.S.%20household%20generates,or%20do%20an%20extensive%20cleanout.
Galvin, David, Maximizing Participation – Part 1: What and Why, Proceedings of the Forth National Conference on Household Hazardous Waste Management, November 6-8, 1989, Orlando, FL, US EPA, page 376
David Nightingale, CHMM, S.C., is Principal at Special Waste Associates. He can be reached at (360) 491-2190 or e-mail [email protected].
Note
1. Nightingale, David, National HHW Facility Survey Results and HHW Collection Effectiveness, Northwest NAHMMA Chapter Conference, Davenport Hotel, Spokane, WA, June 27, 2012.