Swarupa Ganguli and Amanda Singleton
As of September 2012, the landfill gas (LFG) industry now stands strong at more than 600 energy recovery projects in the United States. These projects, operating in 48 of the 50 states, are estimated to have produced 15 billion kilowatt-hours (kWh) of electricity and deliver 52 trillion British Thermal Units (Btus) of energy in 2012.1 Collectively, these projects provide enough energy to power or heat more than 1.8 million homes per year and reduce greenhouse gas emissions equivalent to the carbon sequestered annually by 22 million acres of pine or fir forests or carbon dioxide emissions from 241 million barrels of oil consumed.
Technology Trends and Emerging Technologies
With a substantial presence in the renewable energy marketplace and a long history of projects dating back to the late 1970s, the industry has matured to the point of well-demonstrated technologies, repeated successful demonstrations in a wide variety of sectors of our nation’s economy and a trusted resource for a base-loaded, local renewable energy resource. This article explores some of the recent project trends and policy and financial drivers that are shaping new directions for the industry. Since 2011, the LFG energy industry has experienced a slowdown in direct-use projects, while electricity projects have been growing steadily and the use of LFG as an alternative vehicle fuel has shown promise. Table 1 summarizes the various revenue streams available to finance each type of LFG energy project.
Electricity
Energy recovery in the LFG industry continues to be dominated by electricity generation. Approximately two-thirds of projects in operation generate electricity via reciprocating engines, turbines or microturbines. This segment of the industry has continued to experience growth in recent years and, as of the end of September 2012, 191 megawatts (MW) in new LFG electric generating capacity had come online since 2011. This recent growth rate of 96 MW per year still demonstrates significant, but slightly lower growth when compared with 120 MW of new LFG generating capacity added per year during the period of 2005 to 2010.2
Several different markets and incentives with near-term deadlines have provided a continued demand for LFG electricity projects despite some of the recent downturns in power consumption. One market-driver is the state renewable portfolio standards (RPS). For example, the North Carolina RPS began requiring utilities to provide a percentage of their power from renewable energy, including LFG, beginning in 2012 and ramping up the required percentage of renewable energy required gradually through 2021. Seven new LFG electricity projects and one expansion of an existing project have come online in that state since 2011, with a collective generating capacity of more than 22 MW.3 Several more projects are under construction or in the advanced planning stages in North Carolina to meet the growing demand for renewable energy. Figure 2 shows a recently completed small electricity project that powers onsite landfill equipment and is sold to the local grid.
Other driving incentives for LFG electricity in recent years include state and federal tax credits, grants and loans distributed as part of the American Resource Recovery Act, and utility green power purchase programs. Many of the tax credits driving short-term investment by private companies in LFG electricity projects included a series of near-term deadlines. The two most common federal tax credits affecting today’s LFG electricity projects are the production tax credit (PTC) and the investment tax credit (ITC). The PTC provides a corporate tax credit of 1.1 cents/kWh for LFG for the first 10 years of operation of the project. The deadline for the PTC was recently extended allowing projects to qualify for the PTC if construction begins before January 1, 2014. The ITC provides an alternative crediting mechanism for projects to help provide initial capital for a project instead of crediting the project as the electricity is produced. The ITC provides a one-time grant of up to 30 percent of the construction and installation costs for the facility. The installation schedule for projects receiving these awards is also more accelerated than the PTC program. Projects receiving the ITC must have already begun construction before the end of 2011 and be completed prior to the end of 2013. As of September 2012, the ITC program had provided over $101 million in funding for 46 LFG electricity projects in 21 states.4
Alternative Vehicle Fuel
Since 2011, four new projects have come online that use LFG for vehicle fuel in fleet and other on-site vehicles.5 These projects convert LFG into compressed natural gas (CNG). Prior to 2011, several pilot-scale LFG-to-vehicle fuel projects were brought online, and the first commercial-scale LFG-to-liquefied natural gas (LNG) project was commissioned at the Altamont Landfill in California. Figure 1 shows a CNG fueling station at the recently completed CNG project at St. Landry Parish Landfill in Louisiana.
The recent interest in alternative vehicle fuel projects is driven by three main factors. First, the stability of natural gas prices and updated estimates on long-term domestic natural gas supplies present an economic savings opportunity for waste companies and municipalities willing to transition from diesel to natural gas-fueled vehicles. According to the Department of Energy’s Alternative Fuels Data Center, mid-2012 pricing for CNG averaged $2.12 per gasoline gallon equivalent while diesel averaged $4.13 per gallon.6 Secondly, emissions of particulate matter (PM) and nitrogen oxides (NOX) and overall engine noise levels are drastically reduced when switching from diesel to natural gas equipment. In 2007, the heavy-duty highway rule required a substantial reduction in sulfur content of diesel to reduce PM and NOX emissions from mobile sources. Natural gas-fueled vehicles provide an alternative mechanism to meet the requirements of this rule, in lieu of using ultra low-sulfur diesel fuels, and achieve an even more substantial reduction in emissions of NOX and PM. Finally, renewable forms of natural gas used in transportation, such as LFG that has been upgraded to CNG or LNG, are eligible to participate in the renewable fuels market. This market was created by the Energy Policy Act of 2005 and expanded by the Energy Independence and Security Act (EISA) in 2007 to require 36 billion gallons of renewable fuel by 2022. LFG that has been upgraded to transportation fuel directly or placed in a pipeline and designated to a commercial outlet for transportation use can qualify under this market and the volume of renewable natural gas is tracked by assigning renewable identification numbers (RINs).
Direct Use
The pace of direct-use projects—those projects that provide energy to either an onsite solid waste facility or a nearby industry, commercial establishment or institution for space or process heat—has slowed dramatically in the last several years. Today, this segment of the LFG energy market provides 300 million standard cubic feet per day (mmscfd) of LFG to a wide variety of equipment and sectors of our economy.7 The LFG is used directly in boilers, kilns, dryers, space and process heaters, sludge incinerators, furnaces and for leachate evaporation. This equipment is located at primary, secondary and university institutions; automotive, chemical, food and pharmaceutical manufacturing plants; glass, ceramic and metal artisan studios and biodiesel and ethanol production facilities.
Approximately half of the LFG consumed by the direct-use sector is upgraded from a nominal heating value of approximately 500 Btu per cubic foot (Btu/ft3) for raw LFG to a value of 900 to 1,000 Btu/ft3, approaching that of natural gas. This upgraded LFG is often injected into natural gas utility pipelines or in some cases the upgraded LFG is used to fuel more advanced electric generating equipment such as turbines, or fuel nearby industrial equipment. These projects are collectively referred to as high Btu projects. High Btu projects in which the cleaned gas is injected into the pipeline can provide flexibility for landfills without end users in close proximity and transport the gas further distances from the landfill where higher prices or more attractive renewable energy incentives might be realized.
Since 2011, the direct-use market segment has experienced modest growth of nearly 15 mmscfd, or 7.5 mmscfd per year. This is a sharp decline in the growth this segment realized between 2005 and 2010, when 175 new mmscfd of LFG was brought online, or an average of 29 mmscfd per year.8 The decline of this market is largely driven by the reduction in gas prices, making LFG less cost-competitive with industrial and commercial natural gas prices. The Energy Information Administration reports a spike in industrial natural gas prices of $13.06 per thousand cubic feet in July 2008 compared with a low of $3.90 per thousand cubic feet in October 2012.9 The general economic downturn also slowed the growth of new direct-use projects in recent years as corporations reduced new investments in equipment upgrades and renewable energy projects at their plants.
How LMOP and Your LFG Energy Project Can Work Together
EPA’s Landfill Methane Outreach Program (LMOP) is a voluntary assistance program that encourages the recovery and beneficial use of LFG as an energy resource to reduce methane emissions from landfills. Since 1995, LMOP has assisted in developing more than 560 LFG energy projects, cumulatively reducing and avoiding emissions in the atmosphere by approximately 224 million metric tons of carbon dioxide equivalents (MMTCO2E).10
LMOP estimates there are approximately 500 additional landfills that are candidates for developing LFG energy projects. Together these landfills have a total electric generation capacity potential of 1,200 MW or LFG delivery potential of 107 trillion Btus per year. LMOP provides a variety of free materials and services to explore LFG energy project opportunities, many of which can be found at www.epa.gov/lmop. LMOP tools and services include:
- Direct project assistance
o Analyze landfill resource—LFG modeling
o Identify potential matches between landfills and end users—LMOP Locator
o Assess landfill and end user facilities
o Explore project possibilities—direct-use, electric, cogeneration, alternative fuels
o Initial economic feasibility analyses—LFGcost
- Technical and outreach publications
- Project and candidate landfill database
- Network of 1,000+ Partners
- Listservs announcing request for proposals and industry hot topics
- Support for ribbon cuttings and other public relations opportunities
- State training workshops and national conference
Since 1995, the number of LFG energy projects has increased by 300 percent from approximately 146 projects in 1995 to more than 600 projects today. The types of projects that have come online have changed over the years depending on the available incentives and the prices of natural gas and diesel fuel. There are still many opportunities across the country to use this energy resource and turn what would otherwise be a liability into an asset.
Swarupa Ganguli is team leader for U.S. EPA LMOP. She leads LMOP initiatives to track and maintain a database of national LFG energy projects, estimate emission reductions from the LFG industry, track policies impacting LFG energy projects and help provide assistance to landfills in search of project development partners. Swarupa can be reached at [email protected].
Amanda Singleton is an engineer with Eastern Research Group. She has supported technical assistance and outreach to landfills in the eastern United States for eight years. In this role she has conducted numerous economic pre-feasibility assessments of LFG energy projects using the EPA LFGcost and LandGEM models, tracked project development activities, and answered technical questions to overcome barriers to LFG energy project development. Amanda can be reached at [email protected].
Notes/References
- U.S. Environmental Protection Agency, LMOP Landfill and LFG Energy Project Database, as of September 28, 2012.
- Ibid.
- Ibid.
- U.S. Treasury Department. List of 1603 Awards, as of December 5, 2012. http://www.treasury.gov/initiatives/recovery/Pages/1603.aspx.
- U.S. Environmental Protection Agency, LMOP Landfill and LFG Energy Project Database, as of September 28, 2012.
- U.S. Department of Energy Alternative Fuels Data Center. National Average Price between September 28, 2012 and October 12, 2012. http://www.afdc.energy.gov/fuels/prices.html
- U.S. Environmental Protection Agency, LMOP Landfill and LFG Energy Project Database, as of September 28, 2012.
- Ibid.
- U.S. Department of Energy Natural Gas Industrial Pricing. http://www.eia.gov/dnav/ng/hist/n3035us3m.htm
- U.S. Environmental Protection Agency, LMOP Landfill and LFG Energy Project Database, as of September 28, 2012.
Table 1
![]()
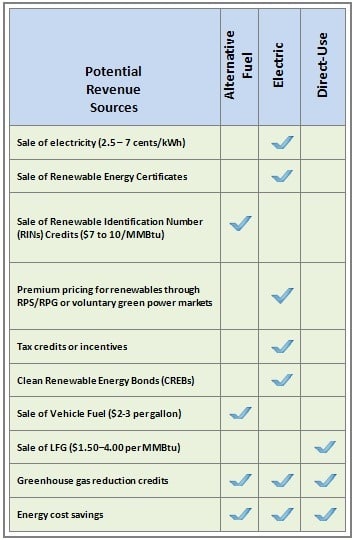
Potential Sources of Revenue for LFG Energy Projects.
Table courtesy of U.S. EPA LMOP.
Figure 1
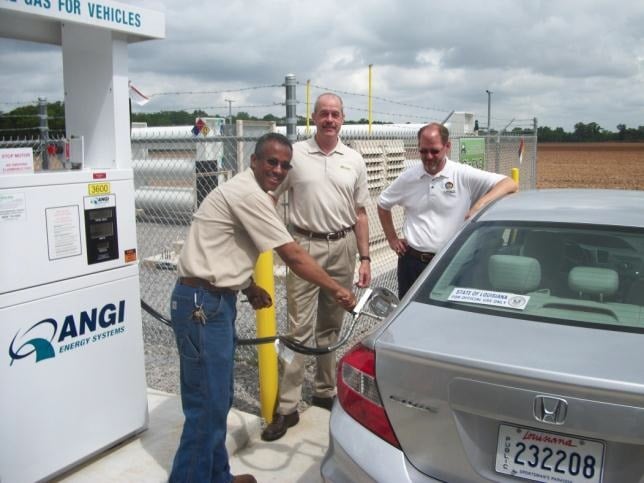
Fueling Station for 250 Gasoline Gallon Equivalent LFG-to-CNG project in St. Landry Parish, LA.
Photo courtesy of St. Landry Parish, LA Solid Waste Disposal District.
Figure 2
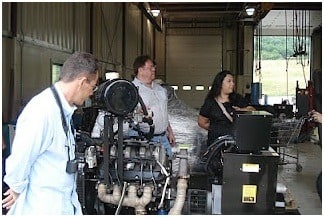
Small (0.195 MW) Engine Generator Recently Installed In Watauga County, NC.
Photo courtesy of Watauga County, NC.