Strategies/Planning
Econometric Modeling of Waste: The Value Proposition in an Uncertain Economy
Examining the interrelationships between the economy, regulatory policies, shifts in material science and downstream waste generation can be done within an econometric framework that is time-tested and nearly ubiquitous in other areas of utility planning.
Navid Nowakhtar
The current economic turmoil we are experiencing as a nation is no secret. Everywhere you turn, there are statistics that show a relatively weak economy that has only begun to recover from the sharpest downturn since the Great Depression. Uncertainty in the general economy is at a near all-time high, and these conditions have a direct impact on the timing and amount of tonnage flowing to landfills and diversion facilities. This places a tremendous amount of pressure on communities that rely on revenues from tipping fees to support waste management programs.
For waste management companies and landfill operators, capacity may be more than adequate to meet the needs of today, but a greater long-term emphasis on waste reduction and prudent management will also demand a more detailed analysis that examines all of the interrelationships between the economy, regulatory policies, shifts in material science and downstream waste generation. Such planning can be done within an econometric framework that is time-tested and nearly ubiquitous in other areas of utility planning.
The Economy and Waste Generation: A Snapshot
The nation is experiencing the highest unemployment rates since the Great Depression, according to data from the Bureau of Labor statistics and IHS Global Insight. No individual sector can claim to have been spared from this softness in labor markets. Florida and California have been especially hard hit areas, with rates hovering around 12 percent for 2010 in both states. The national unemployment picture has improved somewhat, declining to around 8.5 percent as of December 2011 based on data compiled by the U.S. Bureau of Labor statistics. However, this is far from enough job gains to undo earlier losses, and does not account for discouraged workers who have stopped actively seeking work.
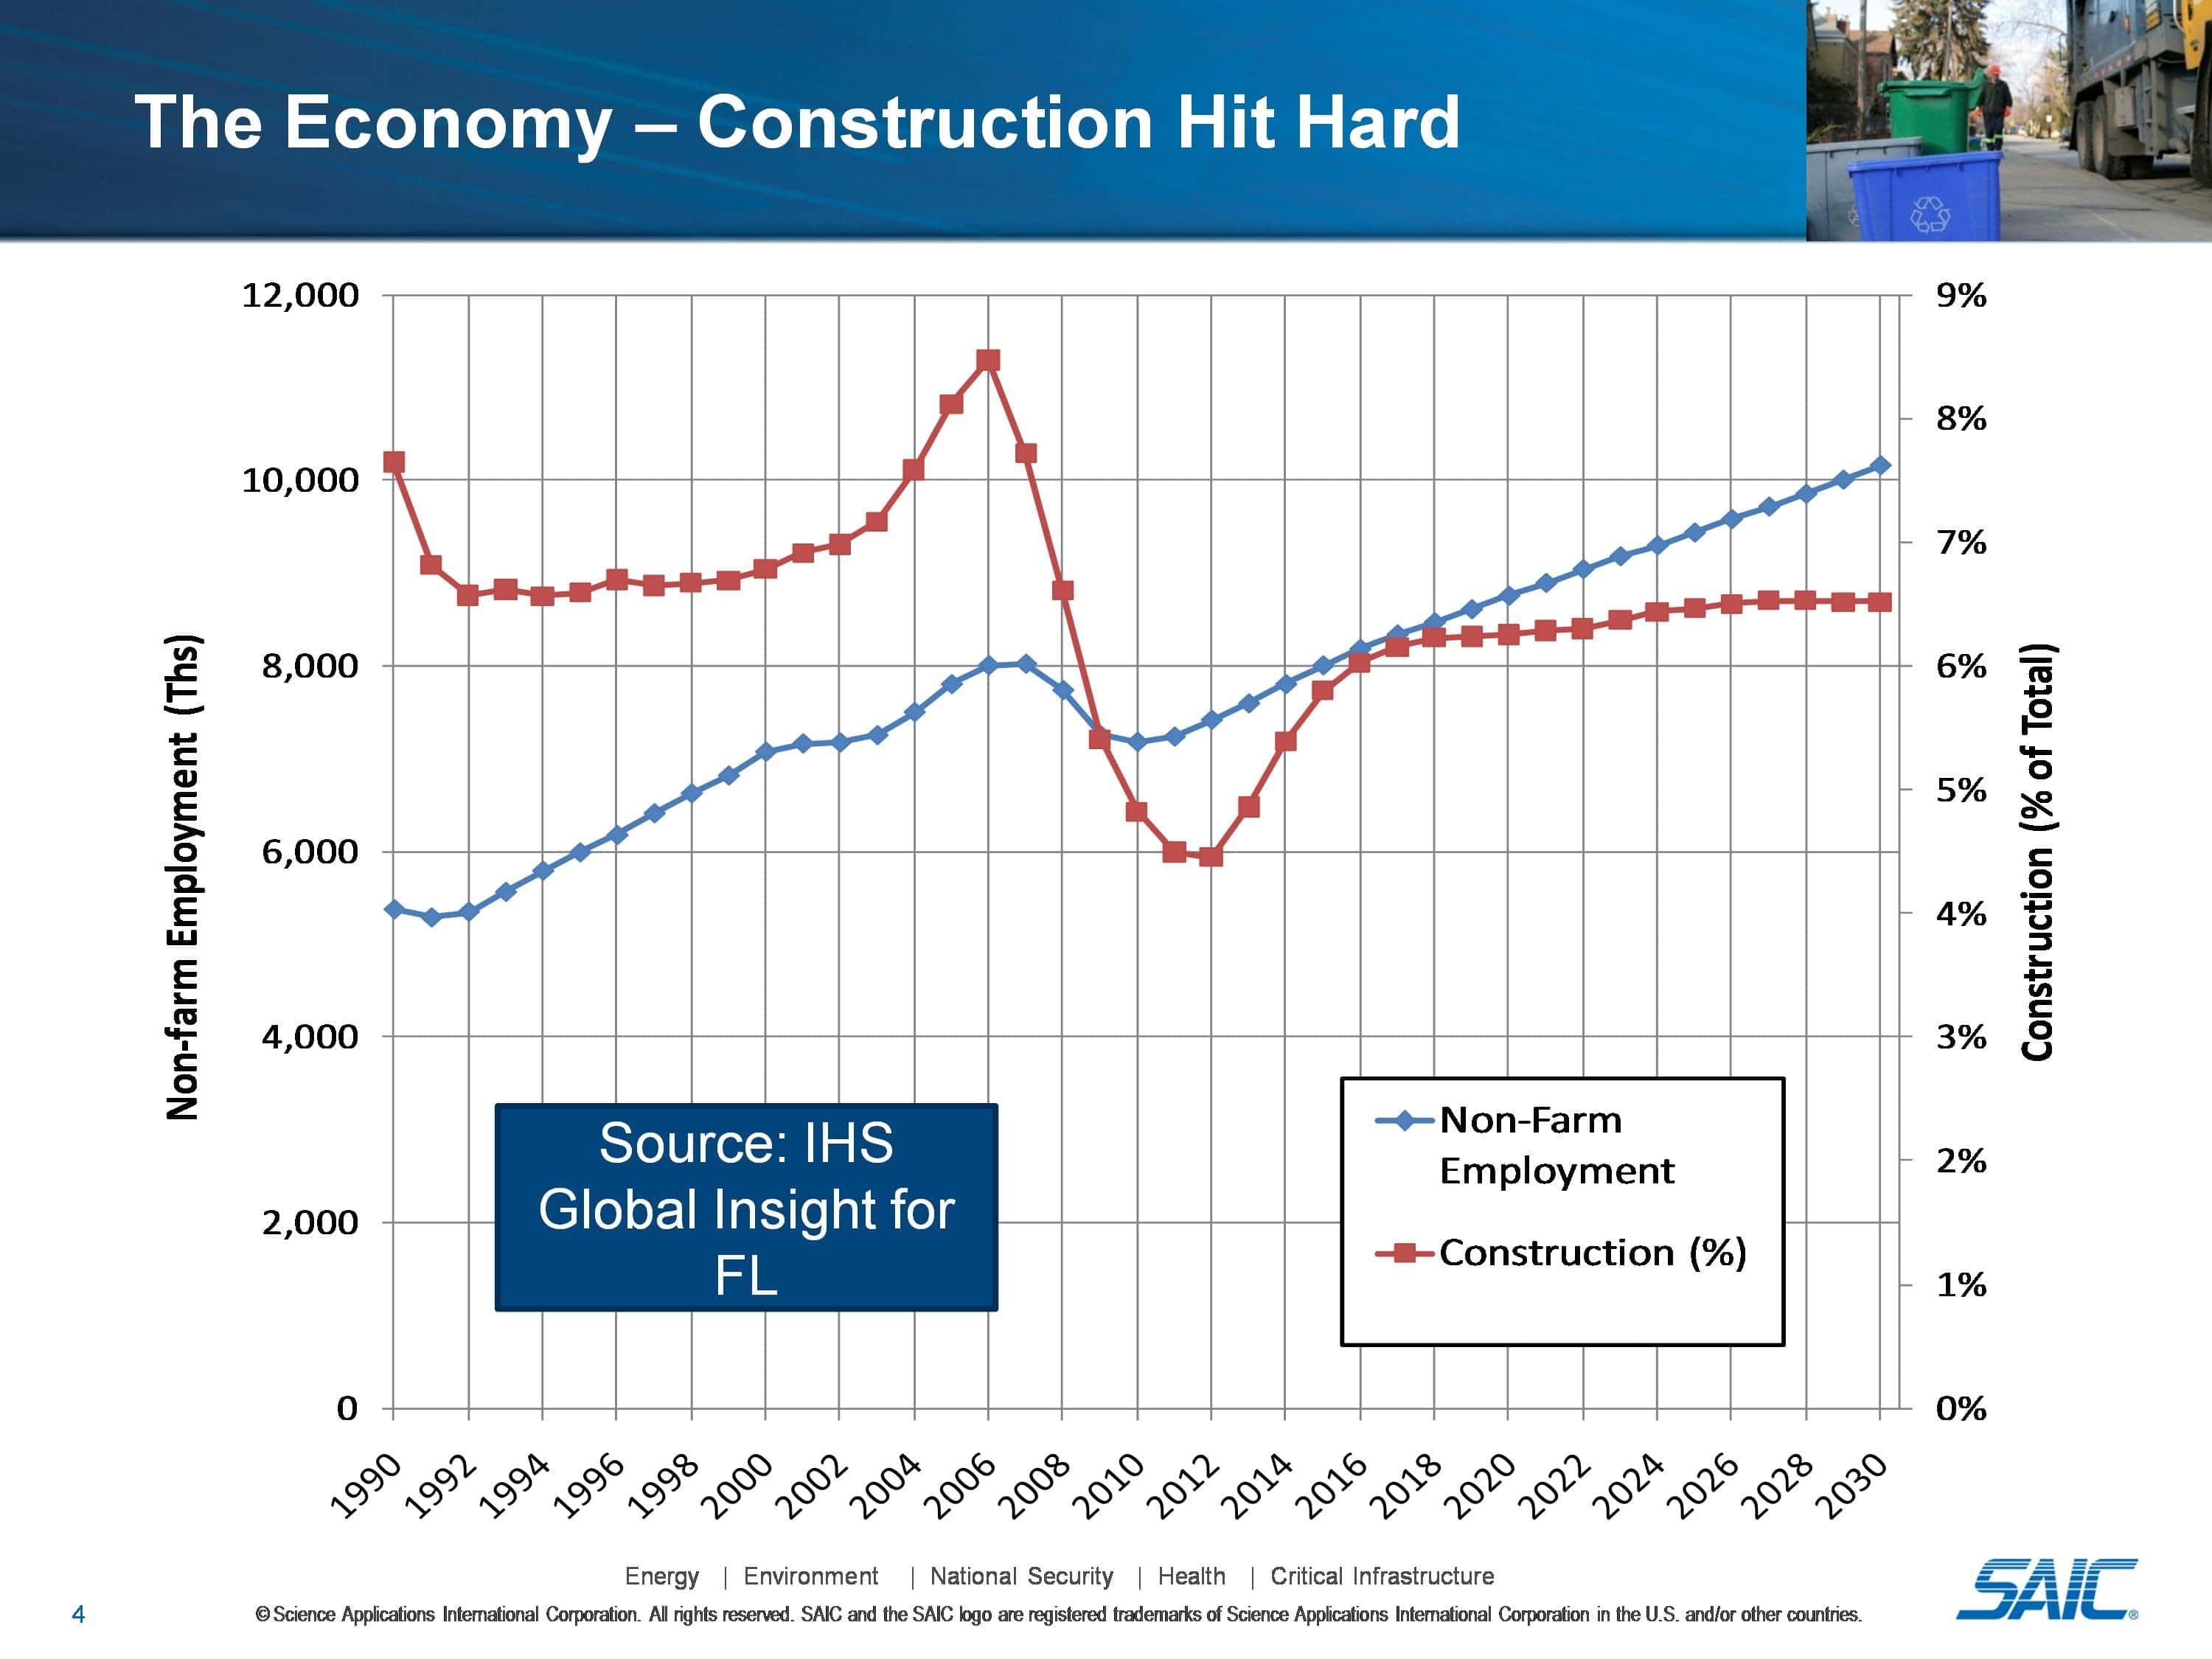
Construction employment, a key driver of construction and demolition (C&D) waste tonnages, has especially been hit hard as a result of the housing crisis, which has caused builders to delay construction projects or abandon them altogether. Figure 1 compares historical and projected IHS Global Insight® (HIS Global Inc.) data on non-farm versus construction employment. According to the Associated General Contractors of America, data from May 2011 (the most recent available) offers little encouragement on the national front, as construction spending in May reached an 11-year low.
Housing prices have plunged, resulting in a significant reduction in overall wealth of the average consumer. The average price for homes in the U.S. has plummeted, based on data maintained by the U.S. Census Bureau and IHS Global Insight. The recovery period for equity could be as protracted as 20 years. Recent initiatives like the Home Affordable Refinance Program are expected to have a small impact in 2012, as buyers in good standing take advantage of lower interest rates, leaving more money to boost consumer spending.
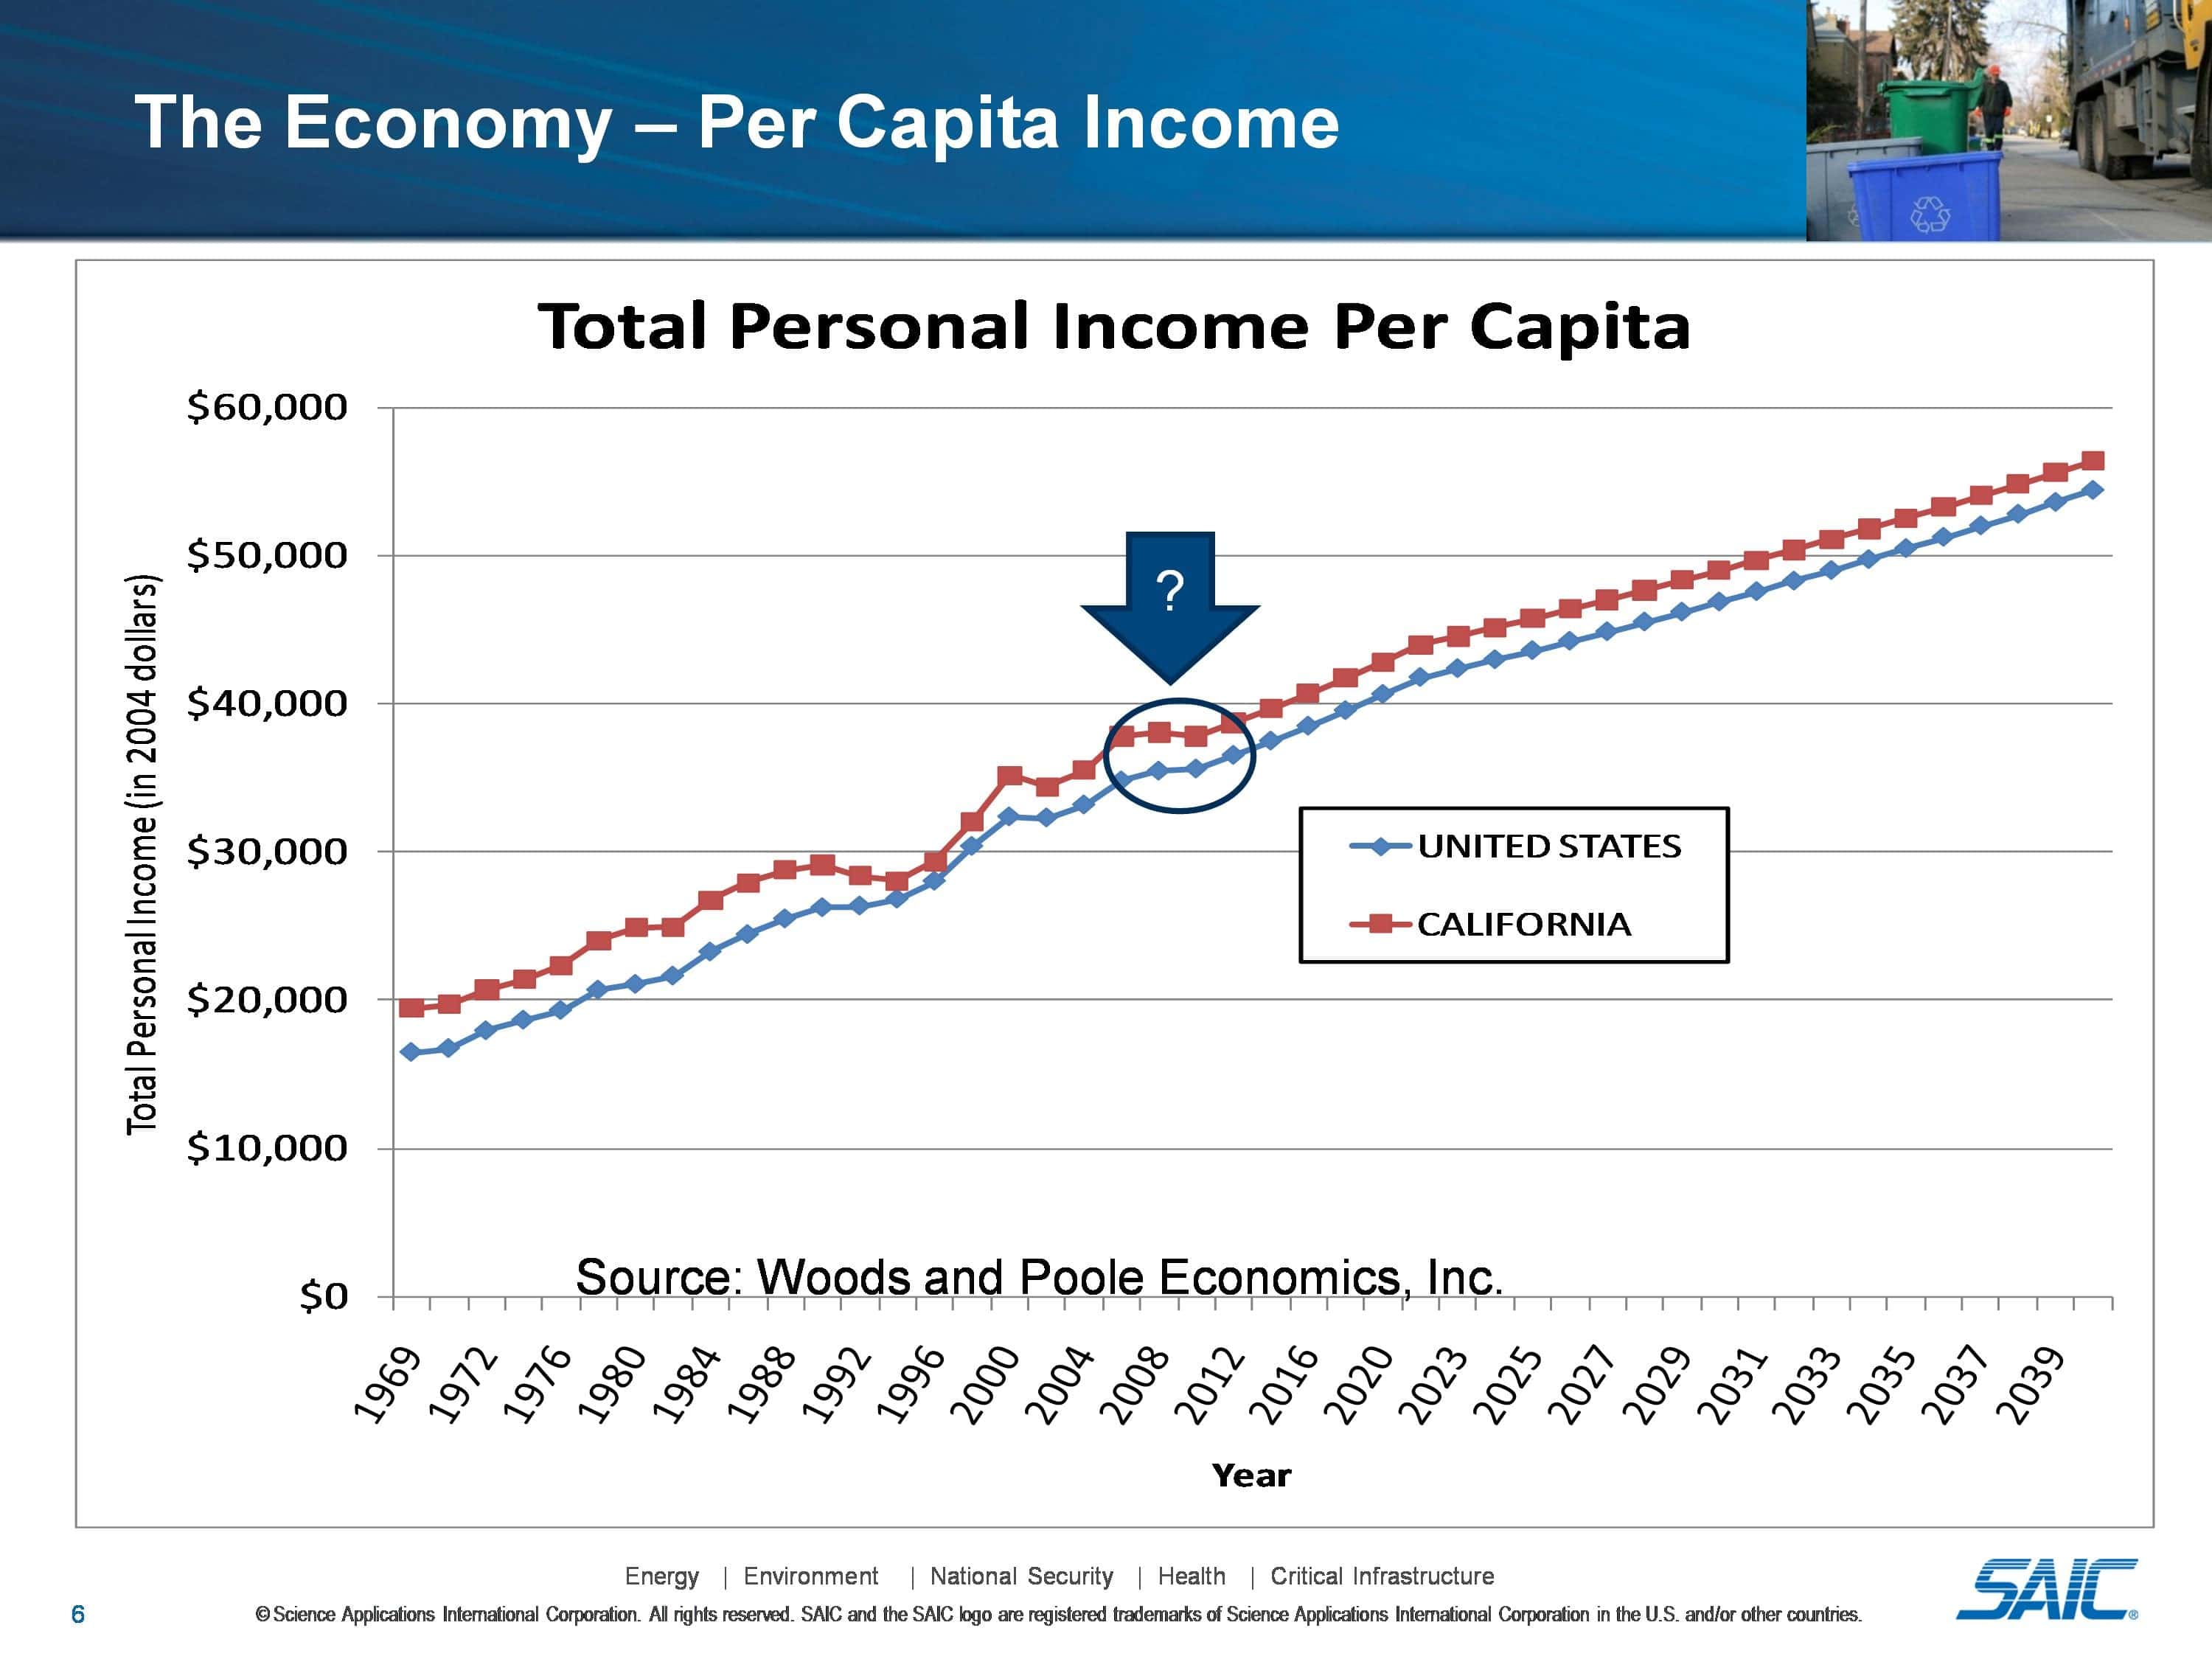
The news is not that much better for incomes, although slow and steady growth is anticipated, as shown in Figure 2, which is based on data from Woods and Poole Economics, Inc. Incomes have barely kept pace with inflation, and Americans have been seeing retail prices rise at an annualized rate of more than 5.6 percent during the first half of 2011 according to the Bureau of Labor statistics. In total, more than 15 percent of the population lived in poverty in 2010, the highest percentage since 1993, according to the most recent data from the Census Bureau.
At the same time, product manufacturers have been encouraged to minimize packaging of products and engage in source reduction to reduce waste. Various incentive-based price discrimination schemes and/or laws, including, for example, pay-as-you-throw structures and extended producer responsibility, are in place that represent a paradigm shift in how customers interact with the waste management industry. An example of recent activity in this realm is New York’s statewide electronics waste recycling law, which takes effect in January 2012, and prohibits waste haulers from collecting e-waste unless it is destined to be recycled or reused.
The microcosm of the C&D industry corroborates these macroeconomic findings. According to two recent reports, one in Virginia and one resulting from an extensive C&D waste characterization study in the state of Georgia performed by SAIC, the economy and the health of waste flow are linked undeniably. According to a recent report by the Virginia Department of Environmental Quality, C&D tonnages declined by 25 percent from 2006 to 2009, primarily due to a combination of a soft economy as well as an increase in Virginia’s recycling rate from 38.5 percent in 2009 as compared to 29.8 percent in 2004. In Georgia, C&D disposal was 23.6 percent lower in fiscal year 2008 as compared to fiscal year 2007, while municipal solid waste (MSW) tonnages remained somewhat flat. This critical component of the waste stream cannot be ignored and, more importantly, cannot be forecasted using simple trending techniques. The Virginia report cites that the estimate for remaining available landfill capacity for C&D is 20.5 years at current rates of throughput. However, what if markets, population and employment fluctuate?
The takeaway from all of this empirical data is simple: communities and municipalities can no longer afford to rely on an oversimplified extrapolation of historical trends as a reliable predictor of potential futures. Doing so, or even combining such an approach with certain other existing techniques, carries with it considerable risks that can better be managed with a more data-intensive econometric modeling framework.
What Are the Risks?
Following is a sampling of potential risks of the status quo approach.
Revenue Projection Uncertainty
Certain communities rely on tipping fee revenues from the operation of facilities. The error in projected or anticipated revenues resulting from simply extrapolating historical trends can be fairly damaging within the context of budget projections.
Overplanning/Underplanning for Disposal and Diversion Capacity Needs
Without a solid understanding of the range of potential futures for waste generation and disposal, communities and waste management stakeholders may (in the long term) either overplan or underplan for capacity within their system and be forced to rely on waste export markets outside their system, presumably at a hefty tip fee premium that must then be passed through to customers.
Inability to Properly Capture or Quantify the Impact of Various Recycling Initiatives on Historical and Future Disposal
By ignoring such market dynamics through simple trending, it becomes impossible to determine whether such policies have persistent, statistically significant impacts on future behavior. If such policies do matter, then a model that assumes measurable impacts will tend to perform better in terms of providing reasonable planning projections of future throughput.
Inability to Experiment with Pricing Structures for Disposal services to Determine Price Responsiveness.
Price elasticity (or the “responsiveness” of consumer behavior as a function of price) as it relates to waste disposal rates and the impact of rising fees to both residential and commercial consumers can be tested in an econometric framework. Assuming the availability of requisite historical information, the model can isolate the impact (if any) of changes in price on disposal behavior.
Omitted or “Unknowable” Variable(s) May Be Driving Short-Term Trends
A more short-term (generally less than five years) view of the drivers of future trends may be subject to undue influence from various omitted or “unknowable” variables that cannot be measured. A longer-term data set allows a modeler to fully tease out a consistent and stable relationship from short-term fluctuations.
“Rules of Thumb” Consider Only Near-Term Reality and Not Longer-Term Relationships.
Rules of thumb are generally only based on recent-term expectations and, more importantly, may not be representative of your particular solid waste system.
Existing Forecasting Methods
Now that we know the risks, let’s take a look at the existing methods of forecasting, some of which can be very useful complements to an econometric approach.
EPA Estimations/Fact Sheets and Rules of Thumb
In this approach, a per-capita generation or disposal rate is extracted from some source or through intuitive experience. In the absence of appropriate historical data, this approach can be a useful high-level planning technique. The key weaknesses of this approach are that such rules only consider the near-term situation and may not be representative of any particular system due to their lack of granularity. There is also no ability to perform scenario analysis.
Linear Trending
This method is as straightforward as it sounds (no pun intended). It does not attempt to explain variation in history, and leaves the user with no ability to perform scenario analysis.
Linear Trending with Rules of Thumb Benchmarking
This is a superior approach to either method 1 or method 2, as there is at least some form of benchmarking that can be done in terms of overall sensibility of the linear trending as compared to aggregated ballpark estimates
Local community-based views or other interview-based techniques. Interviews and insights regarding local conditions are a sound way to bolster the believability of any projection—no one knows more about local conditions than local officials. It is important to note that maintaining objectivity when gathering feedback can be a challenge, and it is critical to balance local perspectives with objective data.
Unit elastic approach. In this method, the future of waste generation or disposal is tied “one-for-one” with a particular economic variable, such as population or income. The key strength of this method is that it does allow the user to perform various “what-if?” scenarios based on the range of potential futures. However, a big weakness of this approach is assuming a one-for-one (or unit elastic) relationship without examining the validity of that assumption throughout history.
Generation rate study/audit. Communities frequently engage in generation rate studies that involve random sampling of homes in the system to audit the amount of waste generated per week for either disposal or diversion and then use such estimates to extrapolate to the entire system and potentially for use in forecasting future tonnages. The main limitation here is again a lack of ability to examine long-term relationships, perform scenario analysis, or control for short-term influences on long-term results.
While far from error-proof or perfection, the econometric method addresses essentially all of these key challenges, as discussed in the next section.
Integrated Econometric Models: Model Structure and Data Requirements
Functional Form
Econometric forecasting makes use of regression to establish historical relationships between waste generation or disposal and various explanatory variables based on fundamental economic theory and experience. The basic structure of such a model is as follows: Waste = f(Xβ ) + ε.
X equals a series of candidate explanatory variables that are believed to be theoretically linked to waste generation or disposal. Several models of this nature have been developed and have shown that some of the key drivers include economic well-being, prices, seasonal or annual variability, the existence or persistence of various waste management programs and strategies, and waste flow control regulations at specific landfills, among other variables. Each system is unique, and a tailored econometric model can be used to tell “your story”.
β equals a series of econometrically estimated parameters (one for each candidate explanatory variable) that determine whether (i) the explanatory variable is a statistically significant driver of waste and (ii) if so, helps to quantify this impact by being retained in the final econometric equation used to forecast future waste, and ε equals model error, which must be uncorrelated to the explanatory variables and random.
In this approach, the significance of historical relationships is evaluated using commonly accepted statistical measures. Models that, in the view of the analyst, best explain the historical variation of waste disposal or generation are selected. The selected models are then populated with projections of explanatory variables, resulting in projections of waste generation or disposal.
Econometric forecasting can be a more reliable technique for long-term forecasting than trend-based approaches and other techniques described above, because the approach results in an explanation of variations in waste generation rather than simply an extrapolation of history. In addition, understanding the underlying relationships that affect solid waste markets allows solid waste industry organizations to perform scenario and risk analyses, thereby improving decisions.
Econometric modeling can be informed by a combination of objective (third party) projections of economic conditions, local information about facility capacity availability, other local conditions and nuances believed to have an impact, and externally derived benchmarks (such as EPA estimates). Econometrics also affords the analyst the ability to make various technical adjustments for short-term fluctuations using specialized statistical techniques that reduce model bias and prevent short-term perturbations form “masking” longer-term relationships. However, there are certain limitations that should be noted, particularly with respect to data quality and availability.
Data Requirements
With respect to data requirements, data is at the heart of the econometric method, and in order for such an approach to be successful above and beyond competing methods, a solid foundation of historical data must be available and/or should be a priority for communities and municipalities moving forward. While recycling data is more difficult to obtain, landfill data may be more readily available. Without good historical data on disposal in tandem with recycling, forecasting either concept econometrically may be challenging.
All of the other data requirements center on the universe of potential explanatory variables, a sampling of which were discussed in the previous section. Most communities have a good handle on rate structures, prevalence of recycling programs or initiatives through history, and can readily purchase third-party economic data for their county or metropolitan statistical area that captures long-term historical and projected economic conditions.
Consequently, the data “bottleneck” is really the quality and reliability of historical disposal or generation data, and the definition of the solid waste system (i.e., are we talking about a county, a borough, a single landfill, etc.?).
Proof of Concept: Econometrics in Action
Model Overview—Where Did the Data Come From?
Data for this example was extracted from CalRecycle’s Disposal Reporting System. The Disposal Reporting System contains detailed data on a by-landfill basis for disposal as well as alternative daily cover. The data contained in the reports is based on information reported by permitted facility operators and compiled by county and regional disposal reporting coordinators. CalRecycle staff is responsible for entering this data into a custom database, checking the data entry, and then releasing the data in yearly increments. Output is available both on a by-origin or by-destination basis.
Econometric Analysis
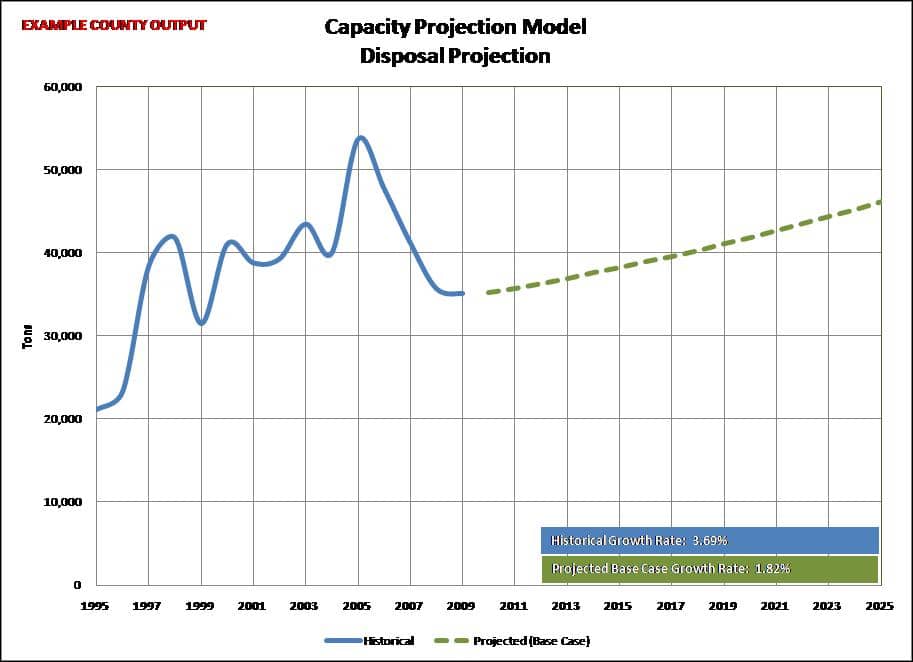
SAIC performed econometric analysis on these data points for each county in California in order to develop forecasts for the quantity of disposed waste originating in each county through 2025. This work was performed under a contract to CalRecycle to help develop CalRecycle’s Facility Information Toolbox. These forecasts were based on economic and demographic data collected by SAIC, and assume, in essence, that current diversion rates in each county remain static at their 2009 levels. Figure 3 shows an example county’s econometric output for the base case.
Notice the perturbations in the most recent period (the ramp up during the build-up surrounding the housing bubble) in Figure 3. Linear or short-term trending would have suggested tonnages that were considerably higher than those experienced through the end of 2009. Furthermore, it is obvious that the intrinsic volatility in reported tonnages is very high, which makes econometric modeling the appropriate tool for capturing a combination of variables to explain such volatility in lieu of unit elastic approaches (which are obviously not borne out by the data in this example) or per-capita rules (which if applicable would suggest far more stability than is borne out by the data).
For each county, SAIC prepared an initial specification (or equation), which was then scrutinized for sensibility and quality several times. Once the equation for each county was finalized, independent projections of the explanatory variables that were retained in the equation (as described above, the results for each system will be unique) were used to extrapolate the historical relationships into the future and produce a base case forecast.
SAIC did not arbitrarily explain away anomalies with econometric adjustments in cases where the relationship between economic well-being and historical disposal were weaker than expected. Care was also taken to develop theoretically sound models. For example, a model that suggests a negative relationship between economic well-being and waste disposal would have been rejected for use, irrespective of its performance with respect to diagnostic statistical measures.
The base case reflects the best estimate for initial planning. Relating this key issue to the note above about theories, economic well-being and waste disposal tonnage have been positively related historically. In the future, as waste reduction measures and emphasis on sustainability continues, such a relationship may actually reverse itself. Such market dynamics make it critical to develop uncertainty bands around the forecast and to allow the modeler freedom to make adjustments to the base case to reflect potential future scenarios. The next section discusses how this same modeling framework can be used to develop risk bands.
Dealing with Uncertainty—Risk Bands
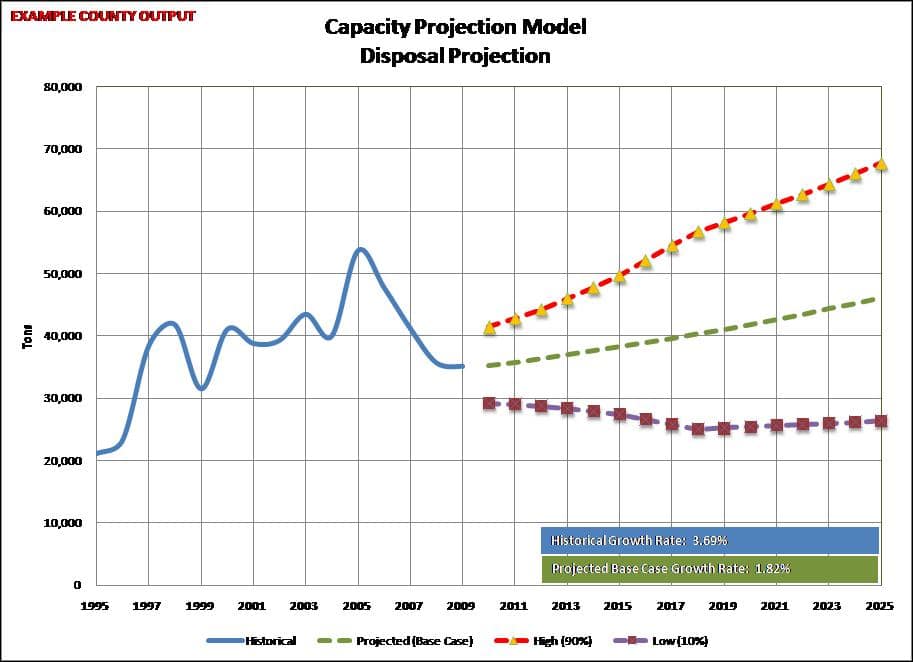
SAIC developed high- and low-case results using the same econometric equations as were developed for the base case, but with simulations of high- and low-case values for the economic drivers. SAIC developed these high- and low-case values based on the historical margin of error in third-party economic providers’ projections of these variables. The high and low cases represent the 90th and 10th percentiles of expected future disposal quantities, meaning that there is approximately a 10 percent likelihood that actual disposal tonnages will be above/below the high/low bounds. Figure 4 extends the results of Figure 3 by adding the high and low bounds developed by SAIC onto the same example results.
Conclusions
In summary, we can conclude the following:
-
An emphasis should be placed on more rigorous, long-term planning approaches that carefully address a range of potential futures and allow for scenario planning in lieu of rules of thumb or simple trending techniques.
-
The econometric framework is a superior method of projecting waste tonnages because it results in an explanation of historical variation rather than a myopic extrapolation of history.
-
An econometric modeling structure affords stakeholders the ability to produce high/low risk bands using the same equation developed for the base case that represents a specific range of uncertainty with respect to expected future outcomes.
-
In order to achieve a successful modeling framework that has econometrics as the centerpiece, a premium must be placed on solid and trustworthy historical data and facility information.
Navid Nowakhtar is an Economic Consultant with SAIC, headquartered in McLean, VA. He has 15 years of experience in both solid waste and energy markets consulting, with an emphasis on statistical analysis in support of forecasting and policy. Navid is a member of both SWANA and the Edison Electric Institute and can be reached at (407) 648-3588 or via e-mail at [email protected].