The Container Recycling Institute (CRI) has calculated more up-to-date estimates of curbside recycling in deposit states using data from CalRecycle for California. CRI adds curbside recycling to overall recycling rates because it gives a more accurate and broad view of the total recycling that happens in a state, as curbside recycling and deposit programs often work in tandem to ensure thehighest diversion and recovery rates possible. 1
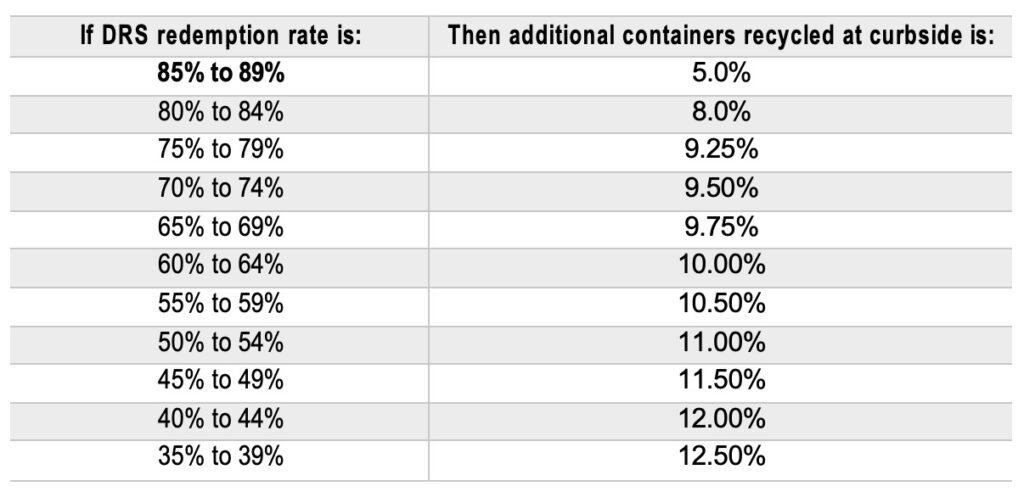
These new curbside recycling estimates affect the deposit beverage container recycling rates in each deposit state. This scale acts as a more reliable estimate of curbside recycling that CRI thenuses to estimate the overall recycling rate for deposit containers in all of the states with deposit returnsystems. Our 10-State File is now updated to reflect this data.
CRI would like to note that the curbside numbers in California are overestimated, because many of the materials recovery facilities (MRF) bales in California have excessive amounts of materials that are not beverage containers.
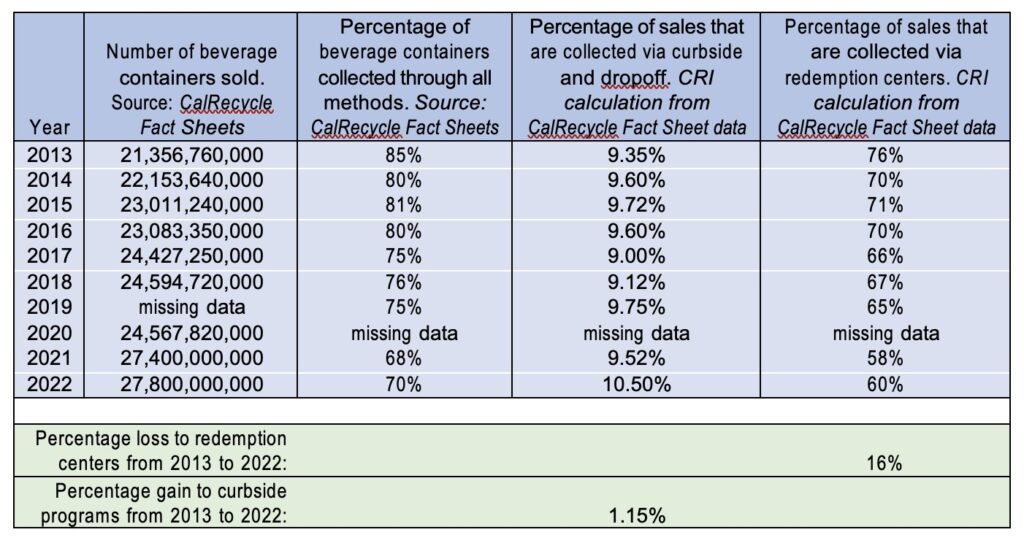
Redemption Center Losses and Curbside Gains in California, 2013 to 2022
Background: CRI obtained 10 years’ worth of data from CalRecycle on beverage containers collected via redemption centers and curbside and dropoff programs. Over this 10-year period, the redemption centers were significantly underpaid, and some were evicted by their retailer hosts,causing more than half of the redemption centers in the state to close. The redemption center closuresled to a steady decrease in the redemption rate over time.
The overall beverage container recycling rate in the state declined from 85% in 2013 to 70% in 2022, a decline of 15 percentage points. The percentage of beverage containers recycled through redemption centers decreased from 76% in 2013 to 60% in 2022. However, the state’s curbside and dropoff programs did not pick up the slack. The curbside and dropoff programs went from receiving 9.35% of the state’s beverage containers to 10.5% of the state’s beverage containers – an increase of only 1.15 percentage points. The remainder of containers presumably went to litter andlandfills.
Nearly all residents in California, 95%, have access to curbside or dropoff programs, per The Recycling Partnership.