Guest Commentary
Examining the Waste Industry’s Safety Trends
Workers want to be safe, and the most important ways their employers can assist them in achieving that goal is by demonstrating that the management genuinely shares the same objective and is committed to attaining that together.
Sonya Bhakta
They say the time spent in college is some of the best years of your life. So when I was completing my bachelor’s in Management at the University of Tulsa (2008 – 2011), I was determined to maximize my college experience. After all, a well-respected freshman professor of mine routinely reminded us to enjoy our time in college, because once we graduate, he said, all we have to look forward to is death. While such a statement is quite dramatic, I knew I must take advantage of every bold opportunity that came my way to enhance my university experience. So, while working in a team of four assigned to write a comprehensive case study of Waste Management, Inc. during my senior year, I found myself captivated with the dynamics of the $52 billion industry.
Prior to this classroom project, I was no different than any other ordinary citizen who lacked a particular interest in examining the lifecycle of trash, and the men and women who put their lives at risk to keep our country clean. But all of that changed in a telephone interview call with David Biderman, Safety Director and General Counsel of the National Solid Wastes Management Association. He informed me that solid waste industry workers face some of the highest occupational injury and illness rates in the United States. More specifically, he noted that public sector employees (those employed by municipalities) sustain workplace injuries and illnesses at a much higher rate than their private sector peers (those employed by for-profit entities). Since little research had been conducted to examine this crucial dilemma that is impacting the entire industry, I started a scientific study to gain insight into this problem that if identified, could lead to reduction in workplace injury/illness rates.
Examining Safety Issues
As I begin to seek support from the industry, I was quick to learn that the private sector was not eager to shed light on this issue. My efforts to secure their participation was fruitless, I was however able to gain cooperation from three municipalities, who permitted access to their sum of 190 frontline workers. While the confidentiality agreement prohibits my ability to disclose the names of municipalities or their agents, I can however share their characteristics, as illustrated in Figure 1.
The frontline workers, primarily collections, were asked to complete an anonymous survey that examined issues pertaining to safety culture, safety climate, injury and illness rates, reporting procedures and safety compliance behavior. Prior to the completion of seven-page survey, participants were asked to sign a separate sheet of paper advising them of the purpose of the study, their rights as participants, how their responses will be used and contact information of primary researcher. Aggregate responses to key items in the survey, which were administered between June and August of 2011, include:
-
92 percent report that they strive to maintain a good safety record
-
69 percent respondents feel that their organization genuinely cares about their safety
-
64 percent report that they received sufficient safety training at the start of their employment
-
56 percent report that their management places a strong emphasis on workplace health and safety
-
41 percent report that they feel pressured to jeopardize their safety in order to complete their tasks on time, while another 41 percent disagreed with the statement
-
41 percent report that they barely have time to take a bathroom break during their shift
-
50 percent report that they have to eat while they work in order to stay on schedule
-
34 percent report that they are rewarded for following safety procedures
-
54 percent report that they always practice lockout/tagout when disabling machinery
-
89 percent report that they use all the necessary safety equipment to do their job
-
87 percent report that they always wear PPE (personal protective equipment) when on the job
Participants were then asked to define causes of most injuries at their workplace, with an option to select as many of the choices below as applicable. Their responses were:
-
Human error: 59 percent
-
Working too quickly: 40 percent
-
Old equipment: 30 percent
-
Poor management: 17 percent
-
Insufficient equipment: 17 percent
-
Inattentive motorists on the road: 12 percent
-
Inadequate safety training: 11 percent
-
Other: 1 percent
Participants were also asked to recall their number of workplace injuries and illnesses within the past year, and a subsequent number of health care visits and leave of absence. Their responses include:
-
31 percent report that they sustained between 1 and 4 workplace injury or illness at their present job within past year that resulted in one day or more of absence
-
26 percent report that they made at least one or more healthcare visit in the past year as a result of workplace injury or illness
-
100 percent of those who sustained workplace injury or illness reported their incidents to their supervisor
-
66 percent of those who sustained workplace injury or illness were paid for by workers’ compensation, according to the respondents
-
30 percent of the respondents took at least one day or more leave of absence as a result of workplace injuries or illnesses
-
An average leave of absence as a result of workplace injury or illness was 9.6 days, an estimate based on the information provided by the respondents
-
The longest leave of absence was 165 days as a result of workplace injury or illness
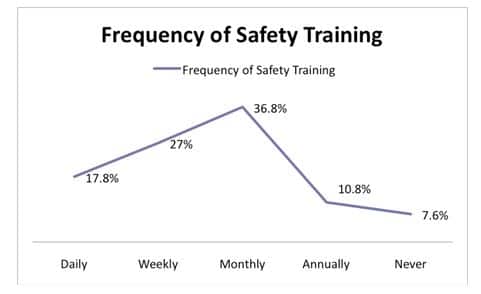
Safety Training
Participants were also asked to specify the frequency of safety training offered at their organizations. As we look at Figure 2, average safety training for most organizations was at least once a month—a frequency that is consistent with that of most private organizations. Surprisingly, 17.8 percent respondents reported that they receive safety training daily. Examples of this could be associating safety message postings or simple words by their leadership, like “be safe” might have been perceived as if they were receiving training daily. Another plausible explanation might be that face-to-face contact with a safety advocate in the organization on a daily basis who reminds them of safety tips daily. Having reviewed safety training programs at all three sites, none are offering training daily, and all three offer training at least once a year. Thus, a possible explanation for respondents stating that they never have safety training (7.6 percent) might be that their relationship with their employer might be less than one year, or that the quality of the safety training is inadequate.
After examining safety training program at all three sites, it appears that City A uses NSWMA safety materials as its primary resources in combination with city recommended safety guidelines. The other two sites, as shown in Figure 3, however, are lacking industry specific safety training materials, which are more relevant and specific to tasks carried out by frontline workers daily. Thus, it is recommended that municipalities like B and C consider either producing their safety training materials for their workers, or purchase them from any one of the vendors servicing the industry.
Discussion of Results
It is vital to note that more than 90 percent of participants have expressed their desire to engage in safer practices, regardless of where they work, characteristics of the leaders to report to or the climate in which they operate. The most important item having a positive impact on the injuries and illnesses rate is the quality of organizational culture and how it views safety. It is important to note that simply complying with safety procedures such as wearing PPE, doing lockout/tagout, and following traffic rules and regulations is not in itself sufficient enough to produce lower workplace injuries/illnesses rates.
Organizational structure seems to have a great impact on safety. Organizations with multiple layers of management (two or more), particularly in situations where senior management is physically removed from frontline workers (i.e., management offices are housed at different location than collection facilities) have exhibited higher workplace injury/illness rates. Additionally, in organizations where ethnic and cultural incompatibility exists between the top management and the frontline workers seem to increase injuries/illnesses rate. It cannot be emphasized enough that organizational structure and management’s approach to frontline workers and how they relate to them in terms of interpersonal relationships has a great impact on safety.
Further, it is imperative that companies not put in place programs that compromise safety. Incentive programs such as allowing workers to leave early upon completion of their tasks may in fact have an adverse impact when promoting safety. Data based on City B that has incentive program in place reveals that such reward system has actually resulted in self-imposed pressure in which workers compromise their safety to complete their 10-hour shifts in seven hours or less so that they can go home early. It is noteworthy to mention that City B had workplace injuries/illnesses rate of 39 percent during the calendar year of 2010, the highest rate when compared with other cities participating in the study.
Concluding Remarks
In summary, workers want to be safe, and the most important ways their employers can assist them in achieving that goal is by demonstrating that the management genuinely shares the same objective and is committed to attaining that together. It is essential for management to foster a culture in which employees can share their ideas and engage in a dialogue on improving safety numbers. Simply delivering safety training, enforcing safety rules, and expecting employee compliance will not alone result in reduction of workplace injuries and illnesses. Organizational culture in which employees are allowed to flourish, promoted from within, held accountable for mishaps, and a culture where mistakes are perceived as an opportunity to improve safety environment rather than simply engaging in write-ups are crucial practices managers can engage in to reduce workplace incidents rate (see Figure 4). It is absolutely essential to stress that management by fear, as precisely managed by municipality C is counterproductive. Leadership team at the municipality C has a positive intent, but the execution method is unsuitable.
Further research is needed to truly understand factors responsible for workplace injuries or illnesses rate in the public sector. As a researcher, it is a particular interest of mine to collect and compare private sector data with public workers to understand if there’s consensus on what they identify as causes for workplace injuries and illnesses. I am especially interested in learning if safety rewards system implemented by many private companies has resulted in underreporting of workplace injuries and illnesses rate, influence unions have on reporting patterns, as well as leadership styles and its impact on safety numbers.
Sonya Bhakta is currently pursuing an MBA at the Pittsburg State University with emphasis on International Business. Her interest is in development of leadership, helping that leadership to improve its business and to make a better work environment for their employees. For comments or to receive a copy of the survey used in this study, e-mail her at [email protected].
I’d like to express my most sincere appreciation to Dr. Brad Brummel of the University of Tulsa for his tremendous support and guidance on this study. I’d also like to thank David Biderman of NSWMA and David Utterback of NIOSH for mentoring me and supporting my research. Lastly, I am incredibly thankful to leaders and employees at all three municipalities for participating in my study.
Figure 1
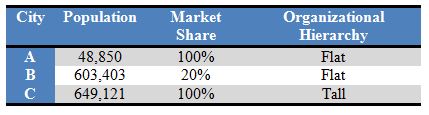
Profile of participating municipalities.
Figure 2
Frequency of safety training.
Figure 3
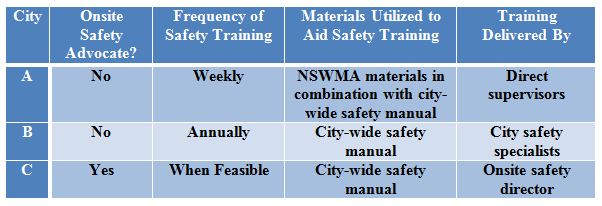
Safety training program at glance.
Figure 4
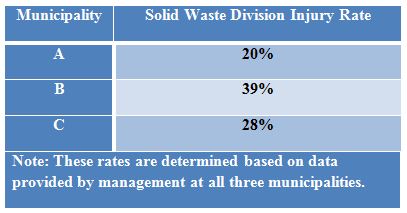
Official 2010 workplace injuries/illnesses rate.
Figures courtesy of Sonya Bhakta.
Sidebar
Demographics
In looking at the demographics and their response patters, few noteworthy observations are made. First, it is no surprise that the solid waste is a predominantly male dominated industry, see Figure A. The workforce is pretty well educated, as evidenced by Figure B illustrating that 76 percent have at least high education or higher. The level of industry experience, Figure C shows that at least fourth of participants have been on the job for less than two years, and this group especially should be the target of safety education.
The age distribution and the level of experience also present some specific safety challenges. At least 24 percent of employees are over the age of 50, see Figure D. Many have expressed in oral interviews that they are slowing down with increase in age and workload. This in itself presents a specific safety challenge in how to assist older workers in conducting their job safely. Also, with the fact that many of the workers being over the age of 50, my data suggests that this population of workers require more time off when occupational injuries/illnesses do occur.
Figure A

Gender distribution.
Figure B
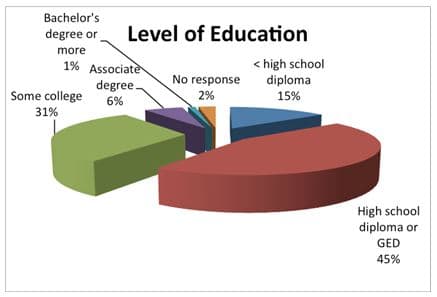
Level of education.
Figure C
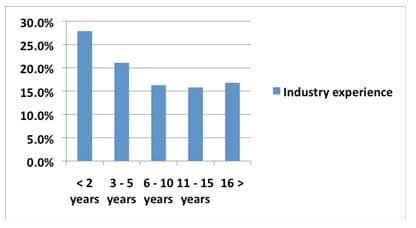
Level of industry experience.
Figure D
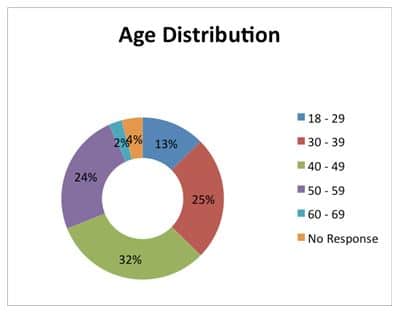
Age distribution.