Idaho Waste Systems’s market study includes reviewing the competitive situation and anticipated pricing options for those competitors.
Darell Luther and Ronda Avery
Idaho Waste Systems (IWS) was introduced to you last month as the participant of a high-level market study provided by Tealinc, Ltd. IWS is a strategically geographically-positioned privately owned northwest landfill that has a lot of positive things going for it. To start, it has invested heavily in operations and landfill infrastructure. It’s operations investments include an all-weather service road so come rain, snow or sunshine, it can offload containers and unload railcars and transport them safely and efficiently to the working face of its landfill. It also has invested in machinery capable of moving these containers and bulk waste in a time efficient manner from railhead to landfill. IWS has also made the necessary investments in its landfill to obtain Sub Title D classification having a fully lined and permitted facility with a commercial siting license to ensure safe and efficient waste disposal operations. They have a permitted capacity of 46 million tons with the ability to expand to over 210 million tons making room for even the largest waste streams. The next step in their process is to fill up their capacity with real business.
Market Study
A high-level market study has the same facets as any in-depth market study without the same level of detail. For IWS, our market study focuses on general waste with the intent of providing disposal options for municipal solid waste (MSW) at the IWS Simco, ID landfill. Since we already have a destination location and capabilities identified, the market study will concentrate on origin locations and rail rate research from those points to the rail station of Simco, ID.
Market studies also include some aspect of the competitive situation and anticipated pricing options for those competitors. In our market study we recognize those competitors but won’t go into the depth required to arrive at pricing for those landfills. At this point, IWS is still learning the landscape for waste-by-rail and the analysis of the potentially competitive landfills requires a very finite review.
Origin Locations
IWS had made exploratory contact with municipalities in California, Oregon and Washington concerning MSW disposal. These contacts yielded some interest but IWS needed indicative rail rate research to get to the next step. Discussions between Tealinc and IWS also indicated that IWS was willing to review opportunities from any municipality to which it could directly market its disposal capabilities. This resulted in 11 origin sites being selected for evaluation: Stockton, Oakland, Colton, Los Angeles, Denver, Omaha, Las Vegas, Albina (near Portland), Salt Lake City, Vancouver and Cheyenne.
Rail Carriers/Rail Rate Research
The rail station at Simco is classified as a captive receiver on the Union Pacific Railroad. This basically means that no other railroad has access to or can provide destination service to IWS at Simco. Albeit there are no restrictions to origin location railroad service, for simplicity sake we used Union Pacific Railroad (UPRR) direct routing for all rail research. For our rail rate research we used generally available public data from tariff publications provided by the UPRR Web site.
Competitive Landfills
Considering the market reach, there are a handful of potentially competitive landfills for IWS targeted business. These landfills have strong relationships with major railroads and provide their own railcars and, in many cases, dedicated origin loading locations and infrastructure. The major competitive landfills include US Ecology (30 miles south of the IWS facility near Simco), Waste Management at Arlington (OR), Energy Solutions near Clive (UT) and Republic Services near Roosevelt (WA).
Rail Rate Research
Navigating through the rail rate research conundrum is always a challenge. Rail rates for waste fall under an asunder of tariffs and most are difficult at best to decipher. It’s always a challenge to find indicative rates for movements of interest without first engaging a railroad employee. That’s where we ended up to get started—engaging an industrial products group sales person at the Union Pacific Railroad. Railroads are much better than they used to be on quoting rates and driving service expectations. In today’s environment a railroad sales or marketing employee considering adding new business to their franchise has to engage a host of internal persons’ prior to quoting rail rates. Consider if rail transportation is “done right”, you as a customer don’t see the internal workings of the railroad just the end result, a railcar(s) being delivered to your siding.
A railroad has two key areas they need to be cognizant of in quoting rates: 1) Does the railroad have the resources to move your traffic as planned? 2) Does your traffic add to the railroad’s overall volume of traffic or does it simply displace existing traffic from existing customer(s)? IWS couldn’t supply enough information to the railroad to have them make an intelligent determination of where IWS potential business fits in with the overall railroad strategy and business. We find this dilemma as a constant since railroads are reticent to supply enough information for a potential customer to make an informed decision, yet expect the customer to have enough business knowledge about potential future business to supply enough information to the railroad to competitively price a movement. Our approach to break out of this mold is to take publicly available data and pricing information to “get started” on a price model.
Price Model
Key inputs to our price model are:
- Standard Transportation Commodity Code (STCC). We used a five-digit STCC—40291—that covered a variety of commodities. These include Waste, Scrap, Nec. A seven-digit STCC would give us one more level of demarcation for a very specific commodity type, but since IWS has a multitude of general waste commodities it can take (municipal solid waste, contaminated soil, construction and demolition debris) we stayed at a higher level for purposes of obtaining general railroad pricing.
- Origin-Destination Pairs. IWS has expressed interest in obtaining rail pricing from select cities and wants to concentrate on MSW. We selected 11 sets of origin-destination pairs representing mostly large municipalities’ arguably large MSW generators.
- Railcar Type. Pricing is often differentiated by railcar type and container. In our model we focused on gondolas as the railcar of choice. This railcar type has been adapted over the years to haul a variety of bulk and baled waste and has the most flexibility and fit for IWS type of business. At this point we have not explored MSW in containers as we believe it would be cost prohibitive from a weight and distance perspective, e.g. and you couldn’t get enough weight on rail to make the price per ton competitive.
Key exclusions to the price model:
- Origin Site Product Processing or Trans-load. One very key exclusion to our price model is the product processing and trans-load cost at the origin rail location. MSW is generally transported in two packaging options. One is to haul it compacted but loose with tarps or covers over the railcars. The other is to haul it baled and shrink wrapped in neat cube like packages maximizing the weight per cubic feet one can transport in a railcar. Either method requires considerations in a trans-load site. If handling in bulk the machinery or conveyors to load are generally required to be in a permitted site with adequate wind protection, odor and site protection along with a host of additional EPA and local DEQ requirements. Baled waste has the same considerations but has the added expense of a baler and bale handling machinery. From a railcar perspective, it’s usually covered with either tarps or hard lids.
- Hazardous Commodities. Hazardous commodities weren’t included in our price model. These types of commodities aren’t accepted by IWS according to its permit. Additionally, hazardous commodities require one more level of complexity to a rail transport movement with more stringent transport requirements and responsibilities transferring to the shipper or receiver.
- Identification of an Origin Load Site. Our assumptions are that we’ll be able to find an origin load site at or near a major city that would be sufficient and lend itself to the necessary permitting to load MSW or other waste commodities to be transported.
Railroad Pricing Results
Our railroad pricing research for the 11 specific origin-destination pairs with Simco representing a constant destination location are represented in the Table 1. Each origin represents an origin area, not necessarily a specific origin loading location. In many areas there are a multitude of existing and potential origin loading locations. The UP6000 mileage is an official tariff by which the Union Pacific Railroad measures distance. The rate research yielded pricing in two categories private rail equipment and railroad rail equipment. If a private railcar is provided it is priced at one rate and if a railroad supplied railcar is provided it is priced at another rate. For each of these categories (Pvt and RR) we also obtained two sets of prices indicated as low and medium pricing. These price differences cover a multitude of waste commodities that fall within the five-digit 40291 Waste STCC. For purposes of our analysis we averaged the two prices and applied the December 2012 fuel surcharge (FSC) to the rate to arrive at a Pvt Per Car Rate and a RR Per Car Rate. We then calculated the difference between a railroad supplied railcar and a private railcar on a per trip basis to provide information to help determine if it’s advantageous to supply your own equipment or use the railroads equipment.
Analysis of the Results
There are many ways to analyze tariff research results. In general, a thorough analysis of the rates and spreads will tell you what the railroad is communicating or if there is an anomaly in the data. Our high-level interpretation of the data includes:
- The RR-Pvt spreads in all cases, with exception of Colton, CA, indicate that the use of a private railcar is required. We believe that the low spread of $158 per trip is an anomaly and would quickly be adjusted if one requested a railroad supplied railcar for the business.
- California is a target market. Looking at northern California, it’s interesting that the congested area of Oakland is discounted to a more central valley location of Stockton. Our previous experience leads us to believe that finding and permitting a transfer station in or near Oakland would be significantly more difficult than in or near Stockton yet the rate differential doesn’t reflect that assumption. Moving toward southern California, we see some of the highest rail transportation rates for our entire study area. Colton is on the eastern edge of the congested area and sports a rail rate slightly higher than a more highly congested area of Los Angeles. Colton’s rail transportation rate average of $7,552 per railcar is the highest of all 11 origin locations.
- Pulling out origin locations west of Simco, we see comparable rates out of Las Vegas and California and considering the mileage differential, similar rates out of the northwest areas of Vancouver and Albina. The spreads between railroad and private supplied railcars for the northwest though are about half of what is being offered in the southwest area.
- Looking east of Simco to origin areas of Denver, Omaha, Salt Lake City and Cheyenne, we see erratic price structures. To further analyze these potentials, we’ve broken them down into more detail allowing across origin comparison on a common basis. That information is shown in Table 2.
Slicing the Data One Level Deeper
To get a clearer picture that allows us to put all the origins on a comparative basis we need to take a deeper cut of the data, we make an assumption on how many tons per railcar we can transport. We know from experience that tonnage per railcar will vary widely. We’ve seen short haul situations where waste has been loaded in 8,000 cube cars literally straight from the collection truck yielding between 65 and 70 tons per railcar load to concentrated baled waste supporting longer hauls, where the load is between 98 and 103 tons per railcar in 4200 cube railcars. Since there is a large variability in weight per railcar, we are going to use a moderate number that gives us conservative load weights without having to make significant investments at a loading location. We’ll run some weight sensitivities at a later point to help get our arms around the value of concentrating waste.
The data in Table 2 reflects the information in the Table 1 sliced by tons per railcar to obtain dollars per ton, dollars per ton mile and dollars per loaded mile. Dollars per ton gives us information from which to do comparative pricing on an absolute basis and dollars per ton mile gives us information that reveals the best priced deal for the weight and distance involved. The dollars per loaded mile help us compare across alternative modes of transportation (if any are available). Our in-depth review of the data includes:
- The origin locations west of Simco are generally priced at the same range with Stockton, Colton, Los Angeles, Albina and Vancouver, ranging from $.080 to $.086 per ton mile for private supplied railcars. The exceptions are Oakland at a low of $.070 per ton mile and Las Vegas at a high of $.091 per ton mile for private supplied railcars.
- The origin locations east of Simco have very scattered pricing with low pricing of $.055 per ton mile at Omaha and high pricing of $.126 at Salt Lake City.
- The origin locations with the best rates on a dollar per ton mile basis are Omaha at $.055 and Cheyenne at $.067. The origin locations sporting the best dollar per ton rates are Albina and Cheyenne.
Price Sensitivity
Our transportation rates were provided via researching the Union Pacific Railroad Web site for published tariff rates. These rates were provided on a per loaded railcar basis. Given this information, it then makes sense that the number one area that effect price is the amount of waste product that can be transported in a single railcar. To increase the tons per railcar, we need to either haul a concentrated waste stream, such as sorted C&D waste or, in this case since our target market is MSW, we need to compare savings to compaction (most likely baling) of waste. As one would imagine the higher the overall rates yield the most savings when more weight per railcar can be transported. Table 3 reflects the difference on a per ton basis when we transport 80 ton per private railcar versus 96 tons per private railcar. Savings range from $15.74 per ton from Colton to $6.80 per ton from Albina and Vancouver. One would need to conduct further analysis on the cost of compaction or baling versus anticipated savings to arrive at a true savings figure, if the end result is indeed a savings.1
Next Steps
The completion of a high-level market study generally generates more questions than are initially answered. That’s one important purpose of it—identify what you don’t know so you can ask the multitude of questions to generate solid dependable answers and business plans. The next logical step would be to take the disposal and transport numbers and explore pricing options with companies or municipalities for “waste” disposal. If the pricing options yield positive benefits to both parties, then a deeper look at origin requirements to support anticipated volumes is logical.
Darell Luther is president of Forsyth, MT-based Tealinc Ltd., a rail transportation
solutions and railcar leasing company. Darell’s career includes positions as president of
DTE Rail and DTE Transportation Services Inc., Fieldston Transportation Services
LLC, managing director of coal and unit trains for Southern Pacific Railroad and
directors positions in marketing, fleet management and integrated network management
at Burlington Northern Railroad. Darell has more than 24 years of rail, truck, barge
and vessel transportation experience concentrated in bulk commodity and containerized
shipments. He can be reached at (406) 347-5237, via e-mail at [email protected] or
visit www.tealinc.com.
Ronda Avery is president of Idaho Waste Systems, Inc. She has been with IWS
since 2000, first as controller and then became president and CEO in March of 2011.
Ronda has been a CPA for more than 30 years and when in private practice specialized
in farming, real estate and small business. She is a member of the American Institute
of CPA’s and The Idaho Solid Waste Association. She can be reached at (208) 724-
8943, via e-mail at [email protected] or visit www.idahowaste.com.
Note
- Market studies include disposal rates so a person can back into a final delivered cost or price to a municipality. Albeit we have that information, in the interest of confidentiality we’ve omitted disposal rates from this article. However disposal rates are available directly from IWS. Contact General Manager Randy Avery at (541) 279-1169 for quotes and more information.
Table 1
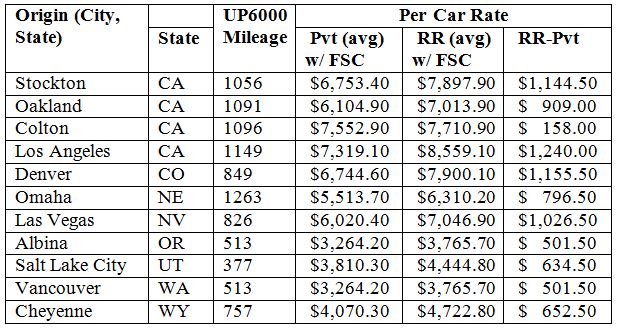
Origin city average per car rates to Simco, ID.
Table 2
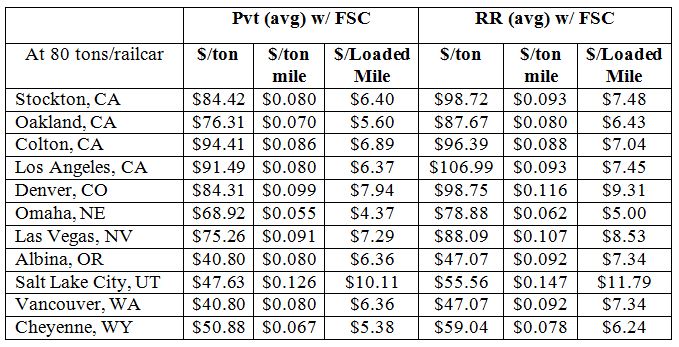
Detailed analysis of private and railroad transport rates.
Table 3
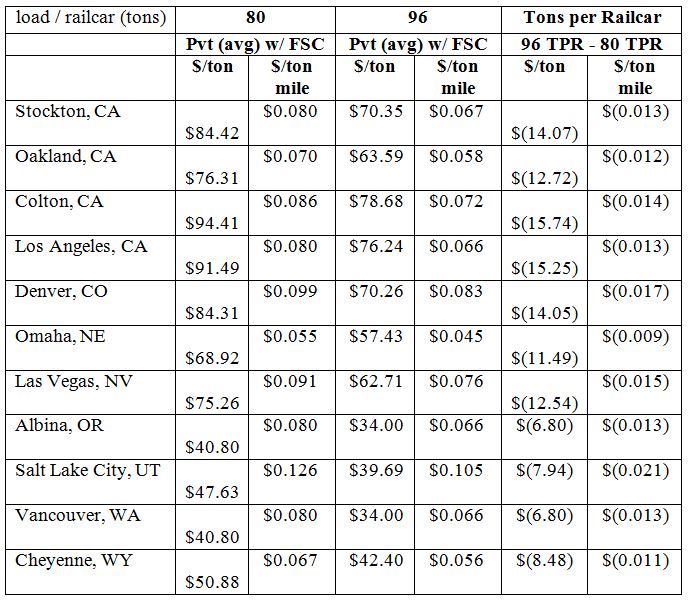
Comparative analysis of price between 80 and 96 tons of material.
Tables courtesy of Idaho Waste Systems, Inc.