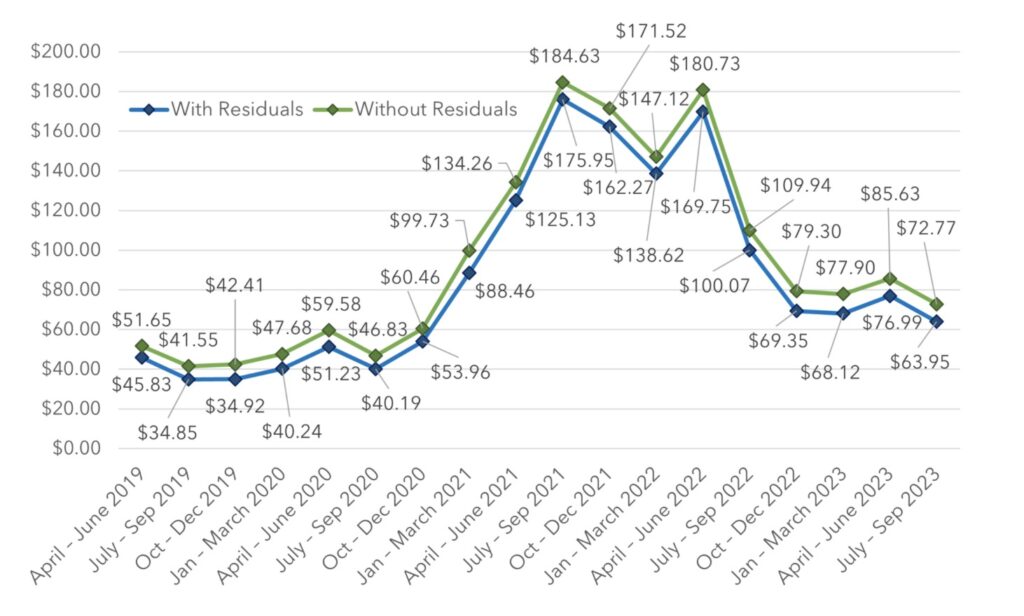
The Northeast Recycling Market Report for the periods April – June 2023 and July – September 2023 showed a slight rise in the average commodity price for Q2 followed by a decline in Q3. The average value of all commodities dropped by 6% with residuals and 7% without from Q1 to Q3.
Average Value Per Ton Trends: Q2 2019 – Q3 2023
The average percentage for outbound tons marketed per commodity in calendar year 2022 reflected a slight increase for most materials compared to 2020. Notably, the average percentage per ton of bulky rigids and mixed plastic decreased. This is the 17th report in NERC’s series of quarterly reports on the market value of commodities from MRFs in the Northeast. The report includes information from ten states: Delaware, Maine, Maryland, Massachusetts, New Jersey, New York, Pennsylvania, Rhode Island, Vermont, and Virginia.
These survey results reflect the differing laws and collection options in the participating states. Four of the states have beverage container deposit laws. As a result, fewer glass bottles, PET bottles and aluminum cans are processed in MRFs in those states. Those MRFs are also likely to have less revenue from those recyclables. In addition, the report reflects a mix of single stream, dual stream, and source separation to collect recyclables with single stream being the most common approach. The type of collection used will have an impact on MRF design and operation. Thus, the data from this report reflects the unique blend of facilities and statewide laws in the reporting states.
1Residuals refers to the incoming material that cannot be marketed and goes to disposal. The value without residuals reflects the value of a perfect ton of marketed material, while the value with residuals reflects the value of each ton processed with the costs associated of disposing unmarketable material. Note: In many cases, recovered glass goes to market but at a negative value.