By investing the time to generate reports that drive better business decisions, safety, service and cost can be measured.
Fred Virga
There are many areas to improve upon in daily business operation, but none has a greater return on improvement than reporting. The pickup/delivery function is only complete when the cost to serve has been identified, and plans for better business decisions down the road have been made. Rising equipment and fuel costs, driver CSA scores, hours of service regulations and the ever-increasing driver shortage influence the need for solid cost reporting. At the end of the day it is all about safety, service and cost.
From private fleet operations to outsourced operations to combinations of the two, companies may say, “You cannot operate our fleet better than we do,” or “Transportation is our core competency.” If you believe that someone else isn’t doing it better than you, you have lost your competitive edge. This guide focuses on how to measure your transportation cost down to the stop level. By measuring cost at the stop level for each driver on each route, other reports can be generated to track safety, service and cost. The following examples are based on a bale route truck operating in the paper recycling sector, but the practice of cost reporting is important no matter what business sector your company operates in.
Step 1: Identify What Makes Up Your Transportation Cost
Accurately capture your total transportation cost. Here is a checklist of items that should be included when computing the cost of your fleet.
Fixed Cost
- Management/Supervisor Wages & Bonuses
- Management/Supervisor Benefits
- Management/Supervisor Payroll Taxes
- Ongoing Driver Recruiting Expenses
- Ongoing Driver Training Expenses
- Driver Uniform Expenses
- Tractor Lease Cost (if leased)
- Tractor Depreciation (if owned)
- Trailer Lease Cost (if leased)
- Trailer Depreciation (if owned)
- Pallet Jack, Forklift, Other Equipment Cost
- Equipment Replacement Cost
- Safety Equipment Expenses
- Insurance Expenses
- Regulatory Compliance Expenses
- Communication Expenses
- Logistics Software Expenses
- Corporate Overhead/Facility Expenses
- Material Securing Equipment Expenses
Variable Cost
- Driver Wages and Bonuses
- Driver Benefits
- Driver Payroll Taxes
- Driver Workers’ Compensation
- Tractor Maintenance Expenses
- Trailer Maintenance Expenses
- Other Equipment Expenses
- Rental Equipment Cost (as substitutes)
- Fuel Expenses – Tractors
- Fuel Expenses – Trailers
- Fuel Expenses – Forklifts
- Permit Expenses
- Toll Expenses
- Accident/Damage Repair Expenses
- Claim Expenses
- Outside Transportation Expenses
- Backhaul related Expenses
- Travel and Entertainment Expenses
Step 2: Separate the Cost Into Fixed Cost, Variable Cost and Fuel Cost
To illustrate, the cost for a one-driver bale route that operates a tractor, trailer, and forklift are:
Annual Fixed Cost $52,520
Annual Variable Cost $74,880
Annual Fuel Cost $48,000
Total Annual Cost $175,400
Step 3: Break Out the Cost Into Weekly Averages
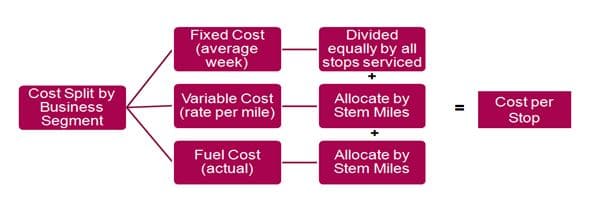
Transportation cost is best measured by week, driven down to the stop level. After the annual total transportation cost is computed using the categories provided above, break out each out. Figure 1 illustrates how cost is broken down by business segment and allocated to each delivery/pick-up serviced.
- Separate your fixed cost by business segment and truck type.
- For example, a paper recycling company that operates rolloff services, bale route services, high-grade services, van swaps, and front-load services has four business segments.
- The fixed cost for each business segment is slightly different due to cost of equipment and driver pay classifications.
Our example consists of one truck type; therefore the fixed cost per business segment is $52,500. The weekly fixed cost is $1,010.
- Break the variable cost less fuel into a mileage rate.
- Divide variable cost less fuel by the historical annual miles.
- This provides an operating rate per mile.
The variable cost for our one truck is $74,880, operating 78,000 annual miles. The mileage rate less fuel is $0.96 per mile.
- Separate the fuel cost and track by truck type (Different equipment burns fuel at different rates per gallon).
The annual fuel cost for our one truck is $48,000. The average fuel rate per gallon is $4.00 per gallon; therefore, the truck burned 12,000 gallons. The truck mile per gallon is computed as:
Total Miles 78,000/12,000 gallons = 6.50 mile per gallon
Step 4: Allocate the Cost Fairly to Each Stop On Each Route
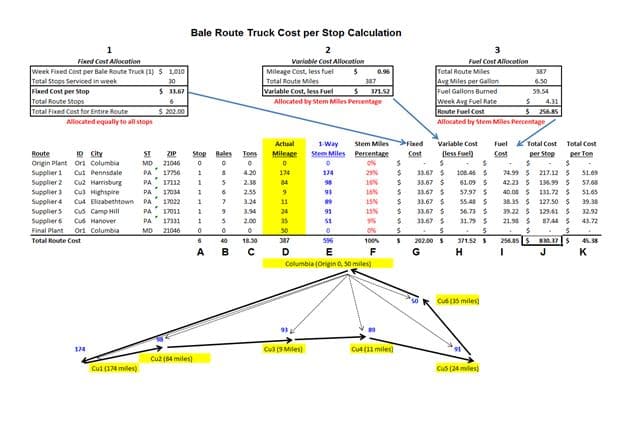
The simplest and fairest method to allocate fixed cost is to allocate the fixed cost to each stop on each route. If you use an alternative method, be sure to be consistent across each route. When allocating variable cost, questions arise about how to handle the “windshield time” (drive time between the origin/plant and the first stop and drive time between the last stop and the origin plant). Other questions include “How is fuel handled?” and “Do we simply charge the actual miles during the route to the closest customer?” Variable route cost is a function of time and should be allocated to each supplier/customer based on proximity to the origin/plant point. This is accomplished equitably by using a Stem Miles Approach. For each route the drivers complete, the cost is allocated back to each route shown in Figure 2.
Legend:
A: Stops serviced within the route
B: Bale count serviced (can add left behind, or change go toters, trailers, etc).
C: Tons serviced
D: Actual miles driven on the route
E: Stem miles (the one-way miles from the origin/plant to each stop)
F: Stem miles percentage (stop stem miles divided by the sum of the stem miles)
G: Fixed cost applied to each stop in the route equally
H: Variable cost, less fuel allocated to each stop by the stem miles percentage
I: Route fuel cost allocated to each stop by the stem miles percentage
J: Total route cost (arrived by adding fixed, variable, and fuel cost per stop)
K: Cost per Ton (by stop and as a route total)
Looks like a lot of math, right? However, this is a one-time setup since all route cost will be allocated using the same method for consistency.
Step 5: Use the Data to Design Key Performance Indicators
For best results, your reporting system should have the functionality of generating these reports by date range, monthly, quarterly, and annually.
- On-Time Performance tracking pick-ups and deliveries to appointment times
- Total spend by business segment/location
- Route Detail with stop detail for each driver, each day
- Route Summary with total stops, miles, and cost for each route
- Truck-type Summary illustrating stops, miles, and cost to operate all truck types
- Driver Summary providing hours, stops, miles, and utilization percentage
- Cost per Supplier/Customer illustrating the delivered cost and service frequency to each supplier/customer serviced
- Weekly KPIs summarizing key stats that drive cost
- For the paper recycling sector, these reports are based on Cost per Ton.
Step 6: Share Your Findings
The reports should become part of the transportation decision process and should be used to build better routes, evaluate supplier/customer service frequency and manage cost. These reports may even be shared to create some competition among drivers. For example, track the mile per gallon rate by driver and post your findings. You will find the drivers to be extremely competitive as each one wants to boast of operating at the best mile per gallon burn rate.
Why Are These Reports Critical to Your Operation?
Performance reports are designed to drive safety, service and cost. These three areas define your operation. While measuring cost at the stop level for each driver on each route, additional reports can track safety and service. If your system is limited and these reports cannot be generated, it is time to ask yourself if you are you truly measuring your transportation cost. A more difficult question to answer is “Do I have the systems in place to capture this cost?” If system constraints are an issue, it may be time to reach out to a third-party logistics provider. Ifyou are not measuring your cost in this much detail, then transportation is not your core competency.
If you are using a third-party carrier for your transportation services and they are not generating these reports for you, it is time for a change. Simply providing equipment and drivers is no longer adequate for logistics providers. When looking for a logistics provider, the measurements that will drive continuous improvement in your business are safety, cost and service (through technology and reporting). Take your transportation to the next level by investing the time to generate reports that drive better business decisions. This time and effort will pay off instantly.
Fred Virga is Vice President of Business Development for Cardinal Logistics Management Corp. (Concord, NC). Fred has provided dedicated contract carriage services for 17 years. He attended St. Bonaventure University in upstate New York, and now resides in Phoenix, AZ. Fred can be reached at [email protected] or visitwww.cardlog.com.
Sidebar
Steps to Allocating Transportation Cost
1) Identify what constitutes your transportation cost.
2) Separate the cost into fixed, variable, and fuel.
3) Break down the cost into weekly averages.
4) Allocate cost fairly to each stop on each route by stem miles.
5) Use the new data to design Key Performance Indicators (KPIs).
6) Share your findings.