Telling the story of how a project will look from the user’s perspective.
By Randy Nolden
A visual impact assessment shows how a potential project might look with respect to existing structures, historical areas, cultural areas, parks, airports and the like. It can be key to helping understand what someone can see of a landfill or other solid waste project—and what they will not be able to see. Rather than trying to understand a two-dimensional plan sheet with existing and proposed contours, powerful software tools can be used to tell the story from the user’s perspective. A visual impact assessment allows stakeholders to “see” the proposed site conditions from a static location through photo simulations that can be a key component of project approval and success.
Visual Assessments Can Make the Difference in Obtaining Project Approval
The ability to visualize the final product of any project may be the difference between a successful and unsuccessful project and may affect whether the project receives regulatory approval or approval from adjacent property owners. In many cases, visual impact assessments are conducted to meet specific regulatory requirements. In some cases, project proponents want to show where the proposed site conditions will be visible, and the steps being taken to mitigate the view of the
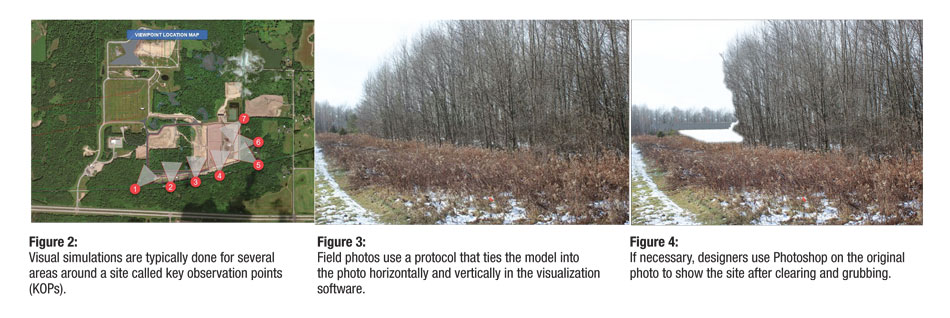
proposed design. In other cases, the visual impact assessment is used to show locations where the design will not be seen due to existing screening or vegetation. Visual simulations are typically done for several areas around a site that have been deemed key observation points (KOPs).
It is a fact of life that people rarely want solid waste facilities to be located near them. Part of appeasing adjacent property owners is showing what the project will look like when it is complete. As part of the process, facility designers can show a visualization from an adjacent property, a busy intersection or a nearby park. It shows how the proposed facility will look using existing screening or with proposed mitigation, including screening berms and vegetation.
Available Visual Assessment Tools
In the past, various tools were used to conduct visual assessments—some more effective than others. One method used until recently was the balloon test—a balloon would be flown to the maximum elevation of a proposed landfill, with pictures taken from different vantage points around the proposed facility. The photos would be used to help understand the height of the proposed landfill.
Nowadays, it is more common to go out to a site after the engineer conducts a desktop study using GIS, aerial imagery, LiDAR and other information to determine the appropriate KOPs. Engineers take the photos and gather accurate GPS data from the photo locations and reference points in the photos. It should be noted that designers must go out into the field and take photos rather than simply using Google maps, which uses a fisheye lens. High resolution raw photos are needed to get an accurate representation of current conditions, and accurate methods are required to obtain the proper photo reference points for visualization.
CAD and GIS software are also used to create a line-of-sight analysis, using field photos along with plan view imagery to clearly show what can and cannot be seen in the line-of-sight profile.
This data is then brought back to the office and added to the proposed 3D models of the facility design to create highly accurate representations of what the site will look like when complete.
Visual Assessment Software
Multiple software packages are used to create a final visual simulation. The latest CAD software is used to create 3D models of the existing ground surface and the design grading for the site, including landfill final cover, perimeter grading and screening. This data is then brought into modeling and rendering software for design visualization, in which engineers define the camera angles, date and time that photos were taken to accurately determine the sun angle within the visualization software. Designers then create the visual simulation of real-world conditions from the location the photos were taken and then export images with the original photos as the background.
Lastly, the exported images are brought into Photoshop and the final images are developed for use in public meetings and other communication requirements. In some cases, objects may be removed or added to the final images as site grading has removed trees or adjusted topography, or screening is added in the form of berms or tree cover. As the final conditions of the site may differ from current photo conditions, objects in the original photo may be removed or added to accurately represent the proposed site development.
In addition, civil infrastructure conceptual design software may be used for dynamic visualization or “on the fly,” to show a proposal in an animated version. The software can be used to quickly add topography, buildings, and roads to a design for enhanced realism.
Landfill Expansion Example
One example of a recent visual assessment was at Marathon County Landfill, near Wausau, WI. As part of the landfill expansion plan of operation, the County was required to “include visual projections from at least four key observation points and
include leaf-on and leaf-off conditions.” A step-by-step description of the visualization process is provided.
Step 1—Assemble Plans
Use final plans for the 3D model, including a landscaping plan as applicable (see Figure 1).
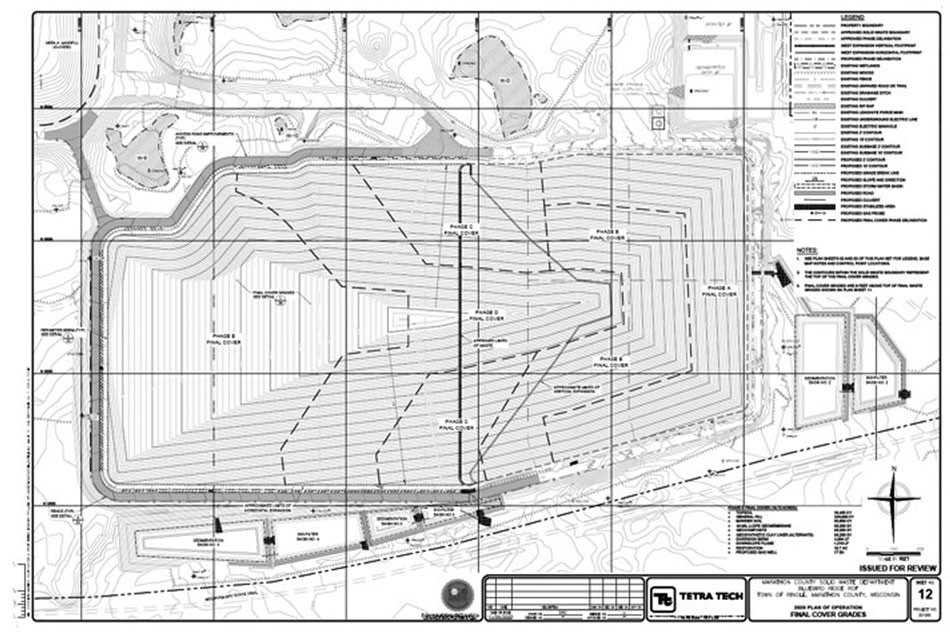
Final site plans are used as the basis for the 3D model.
Step 2—Analyze the Viewshed Analysis and Determine KOPs
Run viewshed analysis using the proposed site data (proposed landfill final cover conditions, buildings and other landfill components) along with first-return LiDAR data to determine KOPs, intersections and adjacent property owners. It is always a good idea to take photos near adjacent properties that fall within the viewshed of the proposed facility. Work with the client to determine KOPs for visualizations (See Figure 2).
Step 3—Take Field Photos
Once the KOPs have been determined, send field staff out to take photos. This process follows a protocol that includes use of a digital camera and tripod, GPS equipment to document photo location coordinates, and reference location coordinates and descriptions. This allows designers to set the photo location and tie the model into the photo horizontally and vertically in the visualization software (see Figure 3).
Step 4—Use Photoshop to Clear Trees
If needed, photoshop the original photo to show the site after clearing and grubbing. Aerial imagery and LiDAR are used to determine heights of trees in the background and “create” an approximate updated background for the image (see Figure 4).
Step 5—Export the Model and Create the Final Image
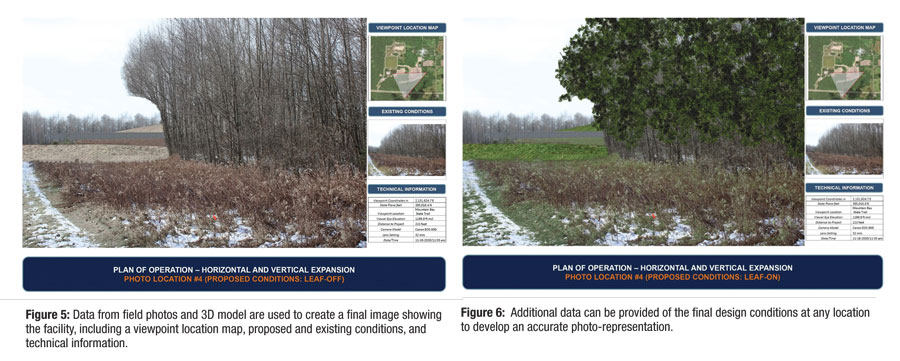
Use the data from the field photos and the 3D model to export an image of the proposed site along with the photoshopped image as the background. Perform additional photoshopping touches to show the proposed facility in perspective. The final image includes a viewpoint location map, proposed and existing conditions and technical information, including photo location coordinates, viewer eye elevation, distance to project, camera information and date/time of the original photo (see Figure 5).
Step 6—Finish Any Additional Requirements
As required, show leaf-on conditions. An accurate photo-representation can be provided of the final design conditions at any location. In this case, there were no adjacent property owners, as photos were taken along a bike path and the Ice Age National Scenic Trail (a thousand-mile footpath that highlights unique glacial remnants). The Ice Age trail cuts through the site property. The visualizations show precisely what the proposed facilities will eventually look like from this vantage point, rather than leaving it to each person’s imagination (see Figure 6).
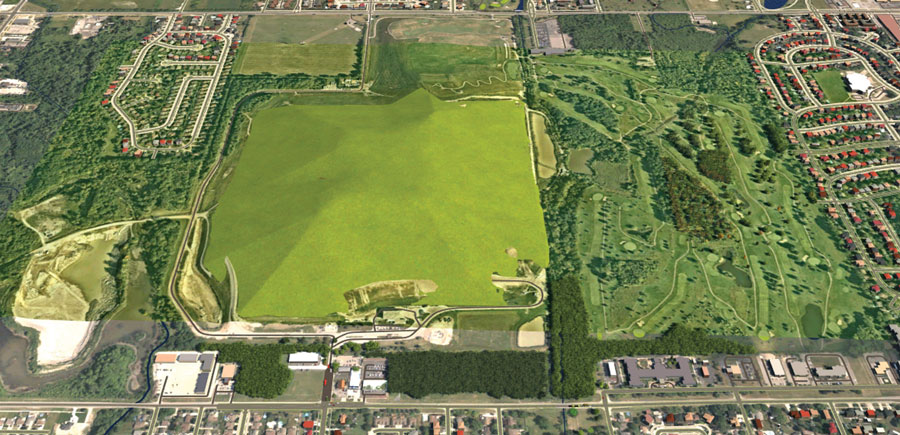
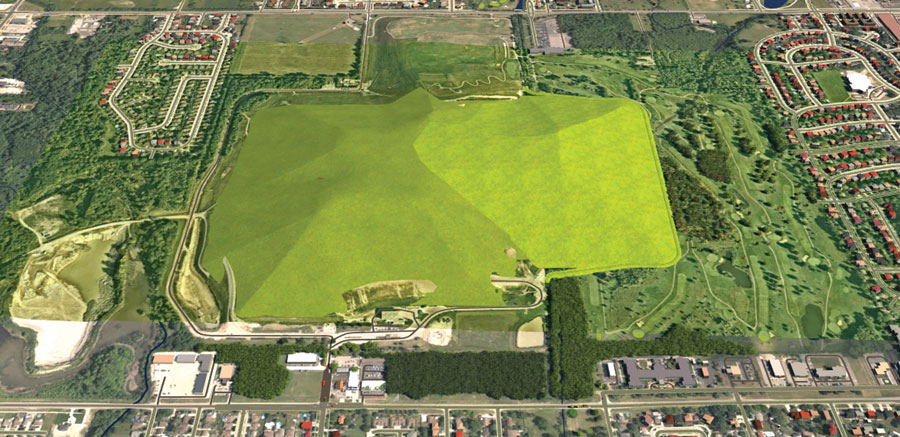
Example of Visualization Results
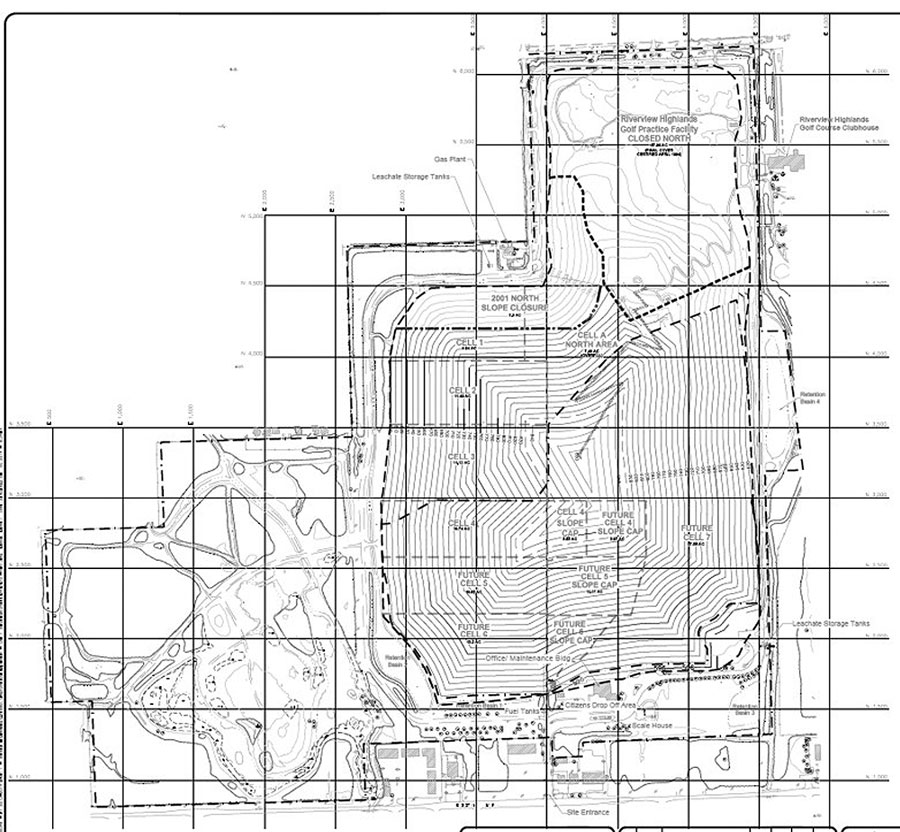
The example shows how much easier it is to describe a proposed site expansion with a visual simulation rather than a plan sheet. The images of a large midwestern landfill show the plan view taken from a permit application plan set next to the visualization of the current topography (see Figure 7). Figure 8 is the visualization of the permitted top of final cover grades, and Figure 9 shows the proposed expansion top of final grades.
Next on the Agenda—Augmented Reality
As technology continues to move forward, design teams are investigating how augmented reality might be used in the future. The ultimate goal is to provide clients, regulatory agencies and adjacent property owners with an app for their phone or tablet that will let them “see” the site dynamically. Rather than the static view presented with current visual simulations, users would be able to have a dynamic view of the proposed site from any location surrounding the site. A user would be able to see a full 360-degree sphere showing the proposed improvements above and below the ground. The user would also be able to get an idea of items such as light posts, fire hydrants, and underground piping, as well as the location of the proposed landfill or other site facilities. | WA
Randy Nolden is a project manager and senior designer at Tetra Tech with more than 20 years of experience conducting visual impact assessments as part of his civil and environmental engineering design, construction, and surveying work with solid waste landfill design and construction. He serves as a project manager, project designer, resident project representative, or office engineer for various major municipal and industrial solid waste design and construction projects. He can be reached at [email protected].